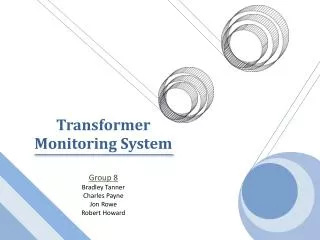
Project Description
Project Description. The Transformer Monitoring System (TMS) is a device that connects to a pole mounted transformer and monitors: Voltages and Currents coming into and out of the transformer Overall temperature of the transformer The phase angle of the voltage and current. Motivation.

Project Description
E N D
Presentation Transcript
Project Description The Transformer Monitoring System (TMS) is a device that connects to a pole mounted transformer and monitors: • Voltages and Currents coming into and out of the transformer • Overall temperature of the transformer • The phase angle of the voltage and current
Motivation • Government wants Smart Grid by 2030 • Need for technologies to counter prolonged downtime of electrical power lines • Tired of power companies relying on the public for important notifications when power is out • No inexpensive method out on the market today that monitors everyday pole mounted transformers
Power Voltage Sensor Brad Brad Current Sensor Microprocessor Wireless Central Hub Brad Charles Jon Robert Heat Sensor Robert Block Diagram
Overall Goals and Objectives • Effectively and accurately read and record valuable information about the transformer • Transfer the data wirelessly without any loss in accuracy to a central hub • Store the data in a database for future use • Display the data in a nice, neat, organized fashion for the user to analyze
Hardware Goals and Objectives • Should be weather proof • Must meet Government regulations • Must be small and lightweight • Easy to install and replace • Non-Intrusive to existing power lines • Must be cost effective
Hardware Specifications • No more than 20 pounds • Less than $200 per unit • Able to handle 50kVA to 100kVA • Able to handle temperatures up to 150⁰C • Able to withstand hurricane like storms
Power Supply Considerations for the power supply • Be able to adapt to changes in the power line • Have the ability to power the system in a power outage
Power supply – Power Tap The power is supplied by two power line taps. These are connected to the 120 volt and ground lines. The wires are then connected to a 120v to 24v step down transformer.
Power Supply – Rectifier Schematic The KBP201G rectifier is used to convert the AC power to DC. The rippled output is then smoothed by a capacitor.
Power Supply – Battery &Charger Two 15 volt regulators are placed at the rectifier output to maintain a constant voltage. Two Schottky diodes are then used to form the simple charging and low power detection circuit.
Power Supply – Voltage Regulators Use of two Diodes Incorporated regulators • 3.3v for microcontroller, Xbee, • 3.1v for supplying DC offset voltage to sensors
Voltage Sensors The problem with commercially available sensors is they measure RMS values or the cost is too great. The solution to the problem was building our own. This kept costs down and within budget.
Current Sensors The problem with commercially available sensors either too bulky or too expensive. The solution was to make a current transducer type sensor.
Temperature Sensor • MLX90614ESF-AAA Infrared Temperature Sensor • Non-Contact: therefore, non intrusive • 90° Field of view • Temperature ranges of -70 to 380°C • Small and compact
ATMEL ATMEGA328 • Why ATMEGA328? • Ease of Development • Arduino Development Board • Simple Straightforward Programming Code • Ability To Remove From Development Board and Insert Directly onto our PCB • 6 Onboard Analog to Digital Converters • No need for PCB mounted ADCs • SCL AND SDC capability to Interface with Infrared Temperature Sensor • Serial Transmit and Receive Capability to Interface with the XBEE Wireless Transceiver
Microprocessor Pin Assignments PIN ASSIGNMENTS
Microprocessor Tasks • Monitor: • Transformer Input and Output Voltage • Transformer Input and Output Current • Transformer Surface Temperature • Data: • Receive and store caution and threshold updates • Transmit transformer line sensor and temperature sensor data • Transmit transformer state
Microprocessor Tasks • Functionality • Transmit data at frequency based on transformer state • Example: • Normal State: 30 minutes • Caution State: 30 seconds • Warning State: 5 seconds • Transmit data when requested by central hub • Transmit threshold values when requested by central hub • Receive threshold value updates when sent from central hub
Transformer States • Critical State • At least one of the sensors is reporting data outside of the normal and warning ranges • Warning State • No sensors are reporting data in the critical range and at least one sensor is reporting data inside of the warning range • Normal State • All sensors are reporting data inside of the normal range
Transformer States DeterminationExample Code: if (VOLT1>V1_LOW_WARNING && VOLT1<V1_HIGH_WARNING){ V1_STATE = NORMAL_STATE; } else if (VOLT1>V1_LOW_CRITICAL && VOLT1<V1_HIGH_CRITICAL){ V1_STATE = WARNING_STATE; } else{ V1_STATE = CRITICAL_STATE; } if (VOLT2>V2_LOW_WARNING && VOLT2<V2_HIGH_WARNING){ V2_STATE = NORMAL_STATE; } else if (VOLT2>V2_LOW_CRITICAL && VOLT2<V2_HIGH_CRITICAL){ V2_STATE = WARNING_STATE; } else{ V2_STATE = CRITICAL_STATE; }
Transformer States DeterminationExample Code: overall_state=0; if (V1_STATE == NORMAL_STATE && V2_STATE == NORMAL_STATE && V3_STATE == NORMAL_STATE && V4_STATE == NORMAL_STATE && TEMP_STATE == NORMAL_STATE && PHASE1_STATE == NORMAL_STATE && PHASE2_STATE == NORMAL_STATE){ overall_state = 1; } if (overall_state == 0){ if (V1_STATE != CRITICAL_STATE && V2_STATE != CRITICAL_STATE && V3_STATE != CRITICAL_STATE && V4_STATE != CRITICAL_STATE && TEMP_STATE != CRITICAL_STATE && PHASE1_STATE != CRITICAL_STATE && PHASE2_STATE != CRITICAL_STATE){ overall_state=2; } } if (overall_state==0) { overall_state = 3; }
Reception of Threshold Updates: Example Update String: @ 201 901 201 901 201 901 201 901 101 51 51 401 701 401 701 401 701 401 701 91 31 31% • A character (@) is sent at start of update string notifying the microprocessor that it is about to receive a threshold update string of chars • Threshold values are sent in a predetermined order with spaces to separate each value • Chars are read from right to left • The chars are converted to integers • Each char of each threshold is multiplied by a multiple of ten and added together • Each threshold is then stored in the processor’s memory
Network Requirements • System must have potential to handle several Monitoring Boxes. • Hub station must be able to directly communicate to Monitoring Boxes. • Monitoring Boxes out of Hub Station range must use closer monitoring boxes to communicate with Station.
Sample Network Diagram Hub station communicates with multiple boxes. Boxes closer to the hub station send relay information from boxes farther away.
Zigbee Advantages • Based on the IEEE 802.15.4 specification. • Designed for mesh networks. • Self-healing network.ex. If a Monitoring System goes down, others that relied on it will reroute through other Systems to get in touch with the hub station.
XBee-Pro ZB Zigbee • XBee modules are simple to work with. • RF line-of-sight range up to 2 miles (63mW transmit power) • 3.3V CMOS Logic(direct communication with microcontroller) • Frequency: 2.4 GHz
USB Data Flow Chart Daemon Program Legend Path data takes ideally Path data takes when web application crashes Database Web Application Software Data Flow • Data flows from serial port to: • Daemon program: parses string input data • MySQL Database: stores data for future use • Web application: displays data, allows user input
DaemonProgram • Handles the connection between the USB port and the database while running in background • Made to be resilient to faults by using try-catch statements. • Tries code until exception is thrown • Tries to deal with exception on its own • If it cannot, falls out of try-catch statement and returns to ready state
DaemonProgram • Parses the input data from the Xbee serial port • Input string will take on the form of either: @(±)##.##(±)##.## ##_ ##_##_ ##_ ##_ ##_ ##_% for receive status updates or: @(±)#.#(±)#.# # # # # # # # # ## # # # # # # # # # ## #% for receive parameter updates
MySQLDatabase • Stores all device status logs • Can be located off-site from both daemon and web server • Stores location filter settings
Web Application • Displays latest node information from database • Allows user to request a new update from a node • Allows user to set new parameters on a particular node • Customizable views