Estimating Proxy BRP Values for Red King Crab Stock: Equilibrium and Stochastic Approaches
90 likes | 214 Views
This study explores methodologies for estimating proxy biological reference points (BRPs) for red king crab stocks through deterministic and stochastic approaches. It focuses on equilibrium yield estimation, identifying fishing percentages (Fx%) and associated BRPs, and performing sensitivity analyses. The research incorporates projection modeling over a 100-year fishery simulation, employing the stochastic S-R model. It conducts diagnostic tests on Fx% to evaluate stock rebuilding potential and extinction probabilities, providing insights into sustainable fishery management practices.

Estimating Proxy BRP Values for Red King Crab Stock: Equilibrium and Stochastic Approaches
E N D
Presentation Transcript
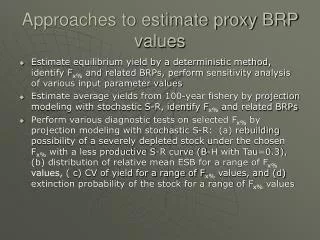
Approaches to estimate proxy BRP values • Estimate equilibrium yield by a deterministic method, identify Fx% and related BRPs, perform sensitivity analysis of various input parameter values • Estimate average yields from 100-year fishery by projection modeling with stochastic S-R, identify Fx% and related BRPs • Perform various diagnostic tests on selected Fx% by projection modeling with stochastic S-R: (a) rebuilding possibility of a severely depleted stock under the chosen Fx% with a less productive S-R curve (B-H with Tau=0.3), (b) distribution of relative mean ESB for a range of Fx% values, ( c) CV of yield for a range of Fx% values, and (d) extinction probability of the stock for a range of Fx% values
What is F%? e.g. F20% is an F which produces a SSB/RF equivalent to 20% SSB/R0 SSB/R0 SSB/RF
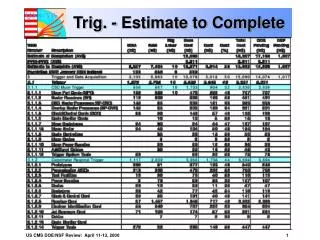
Identification of FX% • Red king crab example - EXCEL
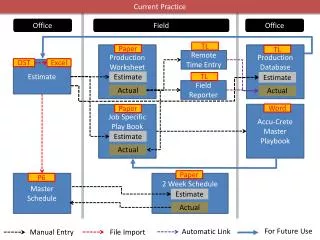
Year class development for stochastic simulation – stock projection modeling
Testing the Stochastic Program • Stochastic program produced results coinciding with the deterministic estimates. e.g., R and Y predictions
Rebuilding red king crab stock from a 20%ESBMSY to MSY level under proposed harvest control rule with F50. The data points correspond to 100-year fishery simulation under stochastic Beverton-Holt S-R model with female ESB, overall recruitment variability, =0.7, serial correlation, = .5, M = 0.18, h = 0.2, mating ratio=1:3, and =0.3
Proportion of years ESB has depleted to < 25%ESBMSYvs. relative ESB/R from 100-year fishery for the red king crab stock. The estimates are made under stochastic Beverton and Holt and Ricker stock-recruitment models with female ESB, M = 0.18, h = 0.2, mating ratio = 1:3, overall recruitment variability, = 0.7, serial correlation, = 0.5, and τ = 0.1-0.3. The proportion of years ESB has depleted below 25%ESBMSY is < 0.02 at F50for all τ values up to 0.3.