
Deep Analysis and Forecasting Trends in Tableau
E N D
Presentation Transcript
Learning Tableau: Chapter 8 แนวโน้ม การจัดกลุ่ม และ การทำนาย(Deeper Analysis – Trends,Clustering, Distributions,andForecasting)
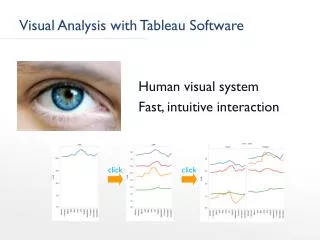
การวิเคราะห์ที่ลึกขึ้นการวิเคราะห์ที่ลึกขึ้น • Scatter plot -> แสดงให้เห็นถึง Outlier และ X-Y correlation • แต่ไม่ได้แสดง Distribution • Time Series -> แสดงให้เห็นถึงค่าที่ขึ้นลง เมื่อเวลาเปลี่ยนไป • แต่ไม่ได้ช่วยทำนายค่าในอนาคตได้
Topics • Trending • Clustering • Distributions • Forecasting
Trend lines • Analysis | Trend Lines | Show Trend Lines หรือ • คลิกขวาแล้วเลือก Show Trend Lines หรือ
สร้าง Timer series แบบด้านล่าง • Filter ให้เหลือแต่ Afghanistan กับ Australia
แสดง confidence band เลือก Trend lines | Edit Trend Lines
หากเราอยากแสดง Trend แค่ช่วงใดช่วงหนึ่ง • ลองเลือกข้อมูลเฉพาะ 1980-1988 (drag / ctrl-click)
Customizing trend lines • Trend line จะบอกว่าราคาจะเพิ่มขึ้น ด้วยความเร็วเท่าไรหากขนาดเพิ่มขึ้น (สำหรับแต่ละชนิดการขาย)
Linear models • หากเราจะโมเดลว่า ราคาจะขึ้นตามขนาดเป็นอัตราคงที่
Log models • เราจะ model ว่า ราคาเป็นไปตาม law of diminishing return (ราคาไม่ได้เพิ่มขึ้นมากตามขนาดที่เพิ่มขึ้น)
Exponential models • เราจะ model ว่า การที่เพิ่มขนาดขึ้นนิดเดียว ทำให้ราคาเปลี่ยนไปอย่างมาก
Polynomial models • เราอยาก Model ให้มัน fit กับข้อมูลที่ซับซ้อน
วิเคราะห์ Model ต่าง ๆ • Model ข้างต้นบางอันอาจจำลองแนวโน้ม (Trend) ได้ไม่ดีเท่าที่ควร • ใช้ R-Square กับ P-value วัด • หาก P-value > 0.05 หมายถึง Model ที่เราเลือกไม่ดีพอ
Export Data • Worksheet | Export | Data-> ใส่ชื่อ File acess • จากนั้น
Topics • Trending • Clustering • Distributions • Forecasting
ตัวอย่างประโยชน์ของการจัดกลุ่มตัวอย่างประโยชน์ของการจัดกลุ่ม • Marketing อาจจะอยากจัดกลุ่มลูกค้าที่มียอดการใช้จ่าย / ความถี่การซื้อ ที่ใกล้เคียงกัน • ผู้อำนวยการโรงพยาบาลอาจต้องการจัดกลุ่มคนไข้ที่มีผลวินิจฉัย / การใช้ยา / จำนวนวันที่รักษา ที่ใกล้เคียงกัน • เภสัขอาจต้องการจัดกลุ่ม Bacteria ที่สามารถต้านกทานต่อยาบางอย่างได้ หรือ มีลักษณะทาง Genetic เหมือนกัน • นักอนุรักษ์พลังงานอาจต้องการจัดกลุ่มกังหันลมที่มีอัตราผลิตพลังงาน และ ตั้งอยู่ในที่ ๆ ใกล้เคียงกัน • Tableau จะจัดกลุ่มโดยใช้ K-mean clustering algorithm
ตัวอย่างจัดกลุ่ม Real Estate • แม้ว่าเราจะเพิ่ม Cluster ในการแสดงผลใด ๆ Tableau ได้ • ตัวอย่างนี้ เราจะเริ่มทำ Cluster จาก Scatter plot จะได้เห็นภาพชัด ๆ
ลองเปลี่ยนค่าต่าง ๆ เล่นดู • ลองใส่ Bedrooms เข้าไปใน Variables ของ Dialog Clusters • จะมีการแบ่ง Cluster ใหม่โดยใช้ Bedrooms เข้ามาเกี่ยวข้องด้วย • Cluster จะไม่แยกจากกันซะทีเดียวเพราะ ตอนนี้เราแสดงผลแค่ 2 มิติ • บ้านใหญ่บางบ้านก็มีแค่ 2-3 ห้องนอน แต่บ้านเล็กบางบ้านมีถึง 4-5 ห้องนอน
การใช้ข้อมูล Cluster • นอกจากการแสดงผล บางครั้งเราต้องการนำผลจากการจัดกลุ่มมาใช้
Topics • Trending • Clustering • Distributions • Forecasting
Features เกี่ยวกับ การกระจายตัว • Confidencesintervals • Percentages • Percentiles • Quantiles • Standard deviations
ใช้ Distribution • Analytics pane, หรือ • Right click ที่แกน เลือก Add Reference Line • เลือก Scope (Table / Pane / Cell) • Edit Distribution: Right click ที่ แกน หรือที่ reference line
ลาก Distribution Band จาก Analytics pane ไปวางที่แกน Price ของ Pane
Topics • Trending • Clustering • Distributions • Forecasting
Forecast vs Trend • Trend จะทำให้เราเห็นแนวโน้ม แต่ไม่ได้ทำนายค่าในอนาคต • บางครั้งข้อมูลจะขึ้นลงตามฤดูกาล (Seasonal) Trend จะไม่สามารถจับข้อมูลลักษณะนี้ได้ ต้องใช้ Forecast Model • เวลาจะ Forecast, Tableau ต้องการ Field ที่เป็น dat • Tableau 10 ที่ไม่ต้องเป็น date ก็ได้ แต่ต้อง Forecast บน Field ที่เป็น integer
แสดง Forecast • Drag and drop Forecast ไปวางจาก Analytics pane • Analysis | Forecast | Show Forecast จาก menu • Right click ที่ view pane
Edit forecast • Analysis |Forecast | Forecast Options จาก Menu
รายละเอียดและสรุป Forecast Model • Analysis | Forecast | Describe Forecast จาก Menu