Download
1 / 7
70 likes | 85 Views
This activity explores the behavior of smoke layers in rooms and atriums during fires based on temperature differences and heat output. It investigates whether the smoke layer rises or falls as the temperature difference increases and discusses techniques to transform a curved graph into a straight line. The use of spreadsheets for drawing appropriate graphs and the suitability of log-log graphs in this context are also explained.

E N D
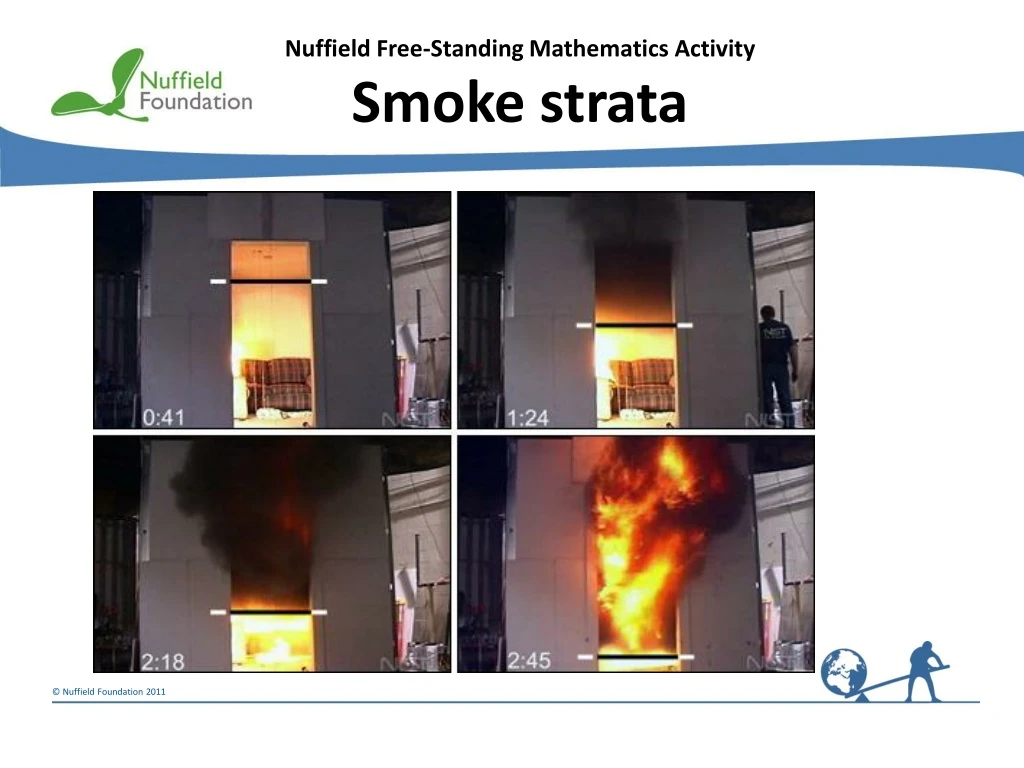
Nuffield Free-Standing Mathematics Activity Smoke strata
Fire produces a layer of smoke at the top of a room. Below this is cooler clearer air. As more smoke is produced and the temperature in the room increases, the bottom of the layer of smoke gets lower. Photos adapted from National Institute of Standards and Technology (NIST) ISO-Room/Living Room Flashover.
Smoke strata Some tall buildings have an atrium. This activity investigates what happens to the smoke layer when a small fire starts there.
Smoke strata In a very tall space, smoke can form a stagnant layer before it reaches the ceiling. The height of the smoke layer above the fire depends on the temperature difference between the bottom and top of the space. Hmetres The height of the smoke layer also depends on the heat output of the fire.
Smoke strata As the temperature difference increases, does the smoke layer rise or fall? Do you think a graph of H against T would give a straight line?
Smoke strata What techniques could you use to change a curved graph into a straight line?
Smoke strata • Reflect on your work Describe how you would use a spreadsheet to draw an appropriate graph to find the values of the constants for the 10 kW fire. Explain why it is appropriate in this context to draw a log–log graph, but not a log–linear graph.