Download
1 / 14
140 likes | 381 Views
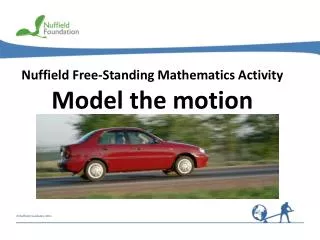
Nuffield Free-Standing Mathematics Activity Gas guzzlers. Gas guzzlers. It is sometimes useful to find a function to model data, then use it to make predictions. Think about ...

E N D
Nuffield Free-Standing Mathematics Activity Gas guzzlers
Gas guzzlers It is sometimes useful to find a function to model data, then use it to make predictions. Think about ... How can you use data on the number of cars with large engines produced in previous years to predict the number of cars that will be produced in future years?
Are there more cars with larger engines on the roads today? Source: www.dft.gov.uk
Think about ... What type of function might provide a good model?
Finding an exponential model N = N0ekt ln N = ln (N0ekt) Taking logs base e ln N = ln N0 +ln ekt Using the laws of logs ln N = ln N0 +ktln e ln N = ln N0 +kt y = c +mx Compare with: Drawing a graph of ln N against t should give a straight line. If so, its gradient will give k and its intercept will give ln N0.
7.351158 7.377759 7.447168 7.519692 7.590852 7.670895 7.724005 7.804251 7.881182 7.961719 8.044947 8.105911 8.163941 8.212568 Cars registered with engine size 2 litres or more
k = gradient = 0.0704 ln N0= intercept = 7.318
predicted value – actual value 100 actual value 2299 – 2262 100 2262 ln N0 = 7.318 From the graph N0 = e7.318 Calculate N0 = 1507 N = 1507e0.0704t Exponential model: Think about ... How good is this model? = 2299 N = 1507e0.0704 × 6 e.g in 2000 i.e whent = 6 % error = % error = = 1.6 %
– 3.3% 1.1% 1.2% 0.9% 0.9% – 0.1% 1.6% 0.7% 0.0% – 1.0% – 2.3% – 1.4% – 0.1% – 2.1% Comparison using percentage errors
Using the model to make predictions beyond 2007 N = 1507e0.0704t Exponential model: Prediction for 2008 t= 14 = 1507e0.9856 N = 1507e0.0704 × 14 = 4037 Prediction for 2009 t = 15 N = 1507e0.0704 × 15 = 4332 = 1507e1.056 The actual values were 3731 and 3768 (thousand). Compare the predicted and actual values. Think about ... Is there a better model?
Finding a new model Draw a graph to show the data for 2000 to 2009. Find a new model. Source: www.dft.gov.uk
Gas guzzlers • Reflect on your work Why is the percentage error a better measure for the accuracy of a model than the difference between the actual value and the value predicted by the model? What is indicated by a negative percentage error? Is your model valid for all values of t?