Download

1 / 47
470 likes | 667 Views
Mastering Oracle Real Application Clusters Performance Tuning at Verizon Wireless S311852. Ian Remedios Ph.D. Director, Global Product Management Oracle Advanced Customer Services.

E N D
Mastering Oracle Real Application Clusters Performance Tuning at Verizon WirelessS311852 Ian Remedios Ph.D. Director, Global Product Management Oracle Advanced Customer Services
The following is intended to outline our general product direction. It is intended for information purposes only, and may not be incorporated into any contract. It is not a commitment to deliver any material, code, or functionality, and should not be relied upon in making purchasing decisions.The development, release, and timing of any features or functionality described for Oracle’s products remains at the sole discretion of Oracle.
Oracle Advanced Customer Services Dedicated to the continual operational improvement of Oraclesolutions and to maximizing the value of Oracle investments. • Solution Lifecycle Management Services • Database and Application Management Services • Industry specific Solution Support Centers • Remote and On-Site Expert Services
What Differentiates Advanced Customer Services • Financial Services • Telecommunications • Aerospace and Defense • Public Sector Broad Industry Presence • Custom Support Packages • 2,500+ World Class Experts • Remote and Onsite Services for unique and complex environments Breadth of Products & Services • High Renewal Rates • Existing customers expand services • Strong References High Customer Loyalty 1 Industry Leadership • Industry/Analyst/Media recognition • for operational excellence
Advanced Customer ServicesFour levels of annual services to meet specific business and budget requirements SolutionSupport Center Business Critical Assistance Performance Optimization Services Virtual Center of Excellence with designated experts Dedicated Hotline Proactive Onsite Support Prioritized Service Requests Personalized Portal Escalation Management Service Delivery Manager Priority Service Advanced Support Assistance Proactive Onsite Support Access to team of service engineers Prioritized Service Requests Personalized Portal Escalation Management Service Delivery Manager Customers can customize their solutions by choosing from more than 50 individual products, tools and expert services Prioritized Service Requests Personalized Portal Escalation Management Service Delivery Manager Escalation Management Service Delivery Manager Personalized Support Faster Problem Resolution Proactive Problem Avoidance Continual Operational Improvement
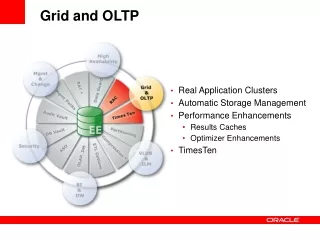
RAC: The Cluster Database Network Users Centralized Management Console Interconnect No Single Point Of Failure High Speed Switch or Interconnect ClusteredDatabase Servers Shared Cache Hub or Switch Fabric Storage Area Network Drive and Exploit Industry Advances in Clustering Mirrored Disk Subsystem
Oracle RAC Architecture public network VIP1 VIPn Service Service Node n Node1 Listener Listener instance n instance 1 ASM ASM cluster interconnect Oracle Clusterware Oracle Clusterware Operating System Operating System shared storage Redo / Archive logs all instances Managed by ASM Database / Control files RAW Devices OCR and Voting Disks
RAC Deployment Cycle Test users Testing and Staging 1 2 Create reference RAC systems Stage gold images Production 1 4 3 5 Scale down Scale up RAC cluster Create Production clusters
RAC Related Service Offerings byAdvanced Customer Services • Configuration • Performance • Patch Assessments • Upgrade Assistance • Patching Assistance • Onsite Assistance • Backup & Recovery Review Assisted Services • Remote Monitoring • Escalation Management Managed Services • Data Migration Advisory • Storage Server Configuration • Database Machine • Assisted and Managed Services 1 Exadata V1 and V2
New: Oracle Customer Success Assessment Get more value from your Oracle investment with Customer Services • 15min Online Survey on 5 Domains • Strategy • Process • Technology • People • Governance • Personalized Benchmark Study • Compare your results to peers • Advice on 25 good practice areas • Recommended actions to take • Oracle services to assist in practice improvements • Navigate Oracle’s service catalog • Complete portfolio of services mapped to IT lifecycle (ITIL) on oracle.com Oracle Customer Success Assessment Assessment URL: http://www.oracle.com/us/products/035498.htm
For More Information http://search.oracle.com Advanced Customer Services or http://oracle.com/goto/acs
Mastering Oracle Real Application Clusters Performance Tuning At Verizon Wireless Session Id: S311852 Syamal Bandyopadhyay
Mastering Oracle Real Application Clusters Performance Tuning at Verizon Wireless • Agenda: • Verizon Wireless Business Requirements for RAC • RAC Implementation / Deployment Architecture • Methodology To Proactively Detect Performance Issues • Techniques / Tips in Resolving Performance Issues • Application Performance Score Card: A 360 Degree View • Conclusions • Q/A
Verizon Wireless Business Requirements for RAC • High Availability • Scalability • Reduced IT cost • Application performance meets or beats non-RAC deployment performance
DB CONFIGURATION • V10.2.0.4 (64 Bit) • DB Size 1.5 TB • 4 Oracle Instances • Data Guard • Flashback • Application: • Business Critical • Customer Facing • 24 X 7 X 365 • 30000 Concurrent Users 30000 RAC Deployment Middleware - Websphere Oracle - RAC (Real Application cluster) • SERVER CONFIGURATION • Sun M5000 • 8 Quad Core CPUs • 64 GB RAM • Solaris 10 (64 Bit) • Platform Components • Symantec SFRAC 5.0 • Hitachi Storage • Shareplex VZWPROD1
Runs on 2 Data Centers • 2 databases identical structure • VZWPROD1 and VZWPROD2 • Oracle’s Data Guard for DR • Physical Data Guard with Maximum Availability • VZWDR1 and VZWDR2 Disaster Recovery Strategy Data Center 1 Data center 2 Middleware Middleware VZWDR2 VZWPROD2 VZWPROD1 VZWDR1 • Oracle – Data Guard (physical)
Bi-directional real time data replication • More than 100 Tables • Replicate data using Shareplex Real Time Data Replication User Data center 1 Data center 2 VZWPROD2 VZWPROD1 2 – Way Data Replication using Shareplex (Quest Software)
Application Load Distribution Data Guard – Preferred Node 4 Shareplex – Preferred Node 3 Application-1 – Preferred Node 1 & 2 Application-2 – Preferred Node 3 & 4 Application-3 – Preferred Node 3 & 4 Middleware Appl-2, Appl-3, Shareplex Appl-1 Appl-1 Appl-2, Appl-3, Data Guard Node 1 Node 2 Node 3 Node 4 VZWPROD1
2 Data Centers • 2 Production Databases – 4 Instances • 2 Disaster Recovery Databases – 4 Instances • Real Time Data Replication using Shareplex • Oracle 10.2.0.4 • Oracle Data Guard • SUN M5000 Servers • Symantec SFRAC 5.0 • Hitachi Storage Deployment Architecture Data center 2 Data Center 1 Middleware Middleware 30000 VZWDR2 VZWPROD2 VZWDR1 VZWPROD1 • Oracle – Data Guard (physical) • Shareplex
Performance Challenges For RAC Implementation • Concern regarding meeting current level of application response time • Inserts are taking significantly longer time • Increased response time for both selects and updates
SQL Response Time – Key Components SQL Response Time Equation: Non RAC: • Response time = CPU time + Wait time (IO wait + Queue time) RAC: • Response time = CPU time + Wait time (IO wait + Queue time + Cluster Wait Time)
Cluster Wait Time • Time to access the blocks/data from the cache of the partner instance(s) • More the # of blocks to access greater the wait time is • Inefficient SQLs make cluster wait time worse • Inadequate indexes increase cluster wait time • Avoid / Minimize Block transfer among RAC instances • Access Paths causing high rate of block transfer: • Full Table Scans • Index Full Scans • Index Fastfull Scans • index Skip Scans
Methodology to Improve Performance • Collect non-RAC production performance stats for all SQLs • Collect RAC test performance stats for all SQLs • Collect performance stats from GV$SQL table • Compare RAC test performance stats with pre-RAC stats • Identify SQLs and database objects having performance issues • Analyze the performance data to detect the root cause of unacceptable performance • Tune the database objects
CREATE TABLESQL_PERF_DATA ( COLLECTION_TS DATE, --- data collection timestamp INDICATOR VARCHAR2(12 BYTE), --- test type e. g . test1 SQLID VARCHAR2(13 BYTE), --- sql_id of the SQL OWNER VARCHAR2(30 BYTE), --- parsing schema name of the sql INSTID NUMBER, --- RAC instance id EXCNT NUMBER, --- # of execution of the SQL ELAPT NUMBER, --- elapsed time (ms) of the sql CPUT NUMBER, --- cpu time (ms) of the sql CWT NUMBER, --- cluster wait time (ms) of the sql LIO NUMBER, --- # of buffer gets per execution of the sql PHYIO NUMBER, --- # of disk reads per execution of the sql ROWCNT NUMBER, --- # rows in result set per execution SQLFULLTEXT CLOB --- SQL full text ) STORAGE........... Table To Collect Performance Data
SQL Script To Collect Performance Data insert into sql_perf_data1(collection_ts, indicator, sqlid, owner, instid, excnt,elapt, cput, cwt, lio, phyio, rowcnt,sqlfulltext) select sysdate, 'ractst01', sql_id, parsing_schema_name, inst_id, executions, elapsed_time/1000/executions, cpu_time/1000/executions, cluster_wait_time/1000/executions, buffer_gets/executions, disk_reads/executions , rows_processed/executions, sql_fulltext from gv$sql where executions > 0 and (elapsed_time/1000)/(decode(executions,0,1,executions)) > 1 and parsing_schema_name in('APPL1','APPL2')
Sample Performance Data Collection Non-RAC Production: RAC Test: Note: Times are in milliseconds per execution
Performance Data Comparison SQL Script Compares the performance stats between any 2 collections of data (e.g. production vs. test; test1 vs. test2, etc.) select a.owner, a.sqlid,a.instid Rinstid, a.excnt Rexcnt, a.elapt Relapt, (a.cput) Rcput, (a.lio) Rlio, (a.phyio) Rphyio, a.cwt Rcwt, (a.rowcnt) Rrowcnt, (a.elapt - b.elapt) "RAC - PROD" , (a.elapt /b.elapt) "RAC over PROD" , b.excnt Pexcnt, (b.elapt) Pelapt, (b.cput) Pcput, (b.lio) Plio, (b.phyio) Pphyio, b.cwt Pcwt, (b.rowcnt) Prowcnt,b.sqlid Psqlid, b.sqlfulltext from sql_perf_data a, sql_perf_data b where a.indicator = 'ractst01' and b.indicator = 'prode' and a.sqlid = b.sqlid order by (a.elapt /b.elapt) desc
RAC Performance Stats Performance Data Comparison Result Set (RAC Elapsed time / Production Elapsed time) (RAC Elapsed time –Production Elapsed time) RAC Performs Better No RAC Performs worse Yes > 1 Non-RAC Performance Stats Note: Times are in milliseconds per execution
Cluster Wait Time Data Collection Methodology • V$SQL view contains cluster_wait_time for every sql • Calculate cluster_wait_time per execution of the sql • Calculate percentage of cluster_wait_time over elapsed_time per execution • Focus on SQLs having: • High cluster_wait_time per execution • High % of cluster_wait_time over elapsed_time • SQLs with high execution frequency
Cluster Wait Time Data Collection Script select sql_id sqlid, parsing_schema_name appl, inst_id instid, executions excnt, cluster_wait_time/1000/executions cwt, ((cluster_wait_time/1000/executions)/( elapsed_time/1000/executions)) "CWT over ELAPT" , elapsed_time/1000/executions elapt, cpu_time/1000/executions cput from gv$sql where executions > 0 and (elapsed_time/1000)/(decode(executions,0,1,executions)) > 1 and parsing_schema_name in ( 'APPL1') order by ((cluster_wait_time/1000/executions)/( elapsed_time/1000/executions)) desc
Sample Cluster Wait Time Data Note: Times are in milliseconds per execution
SQL To Capture Database Objects Having Full Table Scans select b.table_name, b.num_rows,a.frequency, b.owner from dba_tables b, (select object_name, count(*) frequency from gv$sql_plan where operation = 'TABLE ACCESS' and options like '%FULL%' and object_owner in ('SCHEMA_NAME1', 'SCHEMA_NAME2') group by object_name) a where a.object_name = b.table_name order by 4, 2 desc Sample Data:
SQL to Capture SQL_ID doing Full Table Scan SQL to capture SQL_ID doing Full Table Scans select object_name, sql_id fromgv$sql_planwhere operation ='TABLE ACCESS'and options like'%FULL%'and object_owner in('SCHEMA_NAME1','SCHEMA_NAME2')order by object_name Sample data:
Oracle Automated Workload Repository (AWR) • Analyzed AWR • AWR contains significant amount of RAC related stats • Each RAC Instance has its own AWR • Very helpful performance stats for Global Cache blocks sent and received • Interconnect Traffic Volume – for each instance • Database Objects incurring Global Cache Buffer Busy Waits • Database Objects having Consistent Read (CR) blocks received waits • Database Objects with Current Blocks received waits
Additional Oracle Dynamic Performance Views • GV$ACTIVE_SESSION_HISTORY • GV$SESSION_WAIT • These views contain tremendous amount of performance related stats • Identified the database objects with frequent GLOBAL CACHE (gc_%) waits
Table / Index Changes: • Introduce partition / sub-partition – Hash Partition where feasible • Add: freelist / freelist group • Increase INITRANS • Index Changes: • Eliminate if possible • Modify inefficient indexes • Global Hash partition • Make local where feasible • Use Multiple Block Size, especially for indexes • Reduce full tablescans, index fastfull scans, index full scans, index skip scans • Tune SQLs / database objects to reduce the # of logical / physical io Cluster Wait Time Reduction Techniques
Pre-RAC CREATE TABLE TABLEA ( LOGIN_ID …) PARTITION BY RANGE (TIME_STAMP) …… CREATE INDEX IND2 ON TABLEA (ACCOUNT_NUMBER, TIME_STAMP, MTN) ====================================================================== In RAC CREATE TABLE TABLEA .. INITRANS 10 .. FREELISTS 12 FREELIST GROUPS 4 PARTITION BY RANGE (TIME_STAMP) …SUBPARTITION BY HASH (LOGIN_ID)........SUBPARTITIONS 64 … CREATE INDEX IND2 ON TABLEA (ACCOUNT_NUMBER, TIME_STAMP, MTN)TABLESPACE ACSS_2K_IDX03 INITRANS 10 FREELISTS 12 FREELIST GROUPS 4 GLOBAL PARTITION BY HASH (ACCOUNT_NUMBER, TIME_STAMP, MTN) PARTITIONS 64 Table / Index Change : Example
Performance Data Collection : By Applications • Collect performance stats for each Application • Compare RAC test results with non-RAC • Compare non-RAC to RAC production stats • SQL to capture the performance stats: • select parsing_schema_name "appluser", sum(executions) "exec cnt", sum(elapsed_time/1000)/sum(executions) "elap", sum(cluster_wait_time/1000)/sum(executions) "cwt", sum(cpu_time/1000)/sum(executions) "cpu", sum(buffer_gets)/sum(executions) "log io", sum(disk_reads)/sum(executions) "phy io", sum(rows_processed)/sum(executions) "row/exec" from gv$sql where executions > 0 and (elapsed_time/1000)/(decode(executions,0,1,executions)) > 0 and parsing_schema_name in ( 'APPL1', 'APPL2', 'APPL3') group by parsing_schema_name order by parsing_schema_name
Met Goals of RAC Implementation at Verizon Wireless • Achieved the goals: • High Availability • Scalability • Reduced IT cost • Application performance meets or beats pre-RAC performance • Concern regarding meeting current level of application response time… • Met the required performance • Inserts are taking significantly longer time… • Dramatic reduction of the elapsed time for inserts • Increased response time for both selects and updates… • Improved to meet the goals
Conclusions • Identify SQLs and Database Objects having High Cluster Wait Time • Cluster Wait Time must be reduced • Use the Techniques to reduce Cluster Wait Time • Partition / Sub-partition tables • Partition indexes (preferably Hash) • Use Freelist Group • Use Freelist • Increase initrans • Remove unnecessary Indexes • Reduce Full Table Scans, Index Full Scans, Index Fastfull Scans, Skip Index scans • Use Multiple block size (2K, 4K, 8K, etc.)
Q&A THANK YOU!!!