Download
1 / 1
10 likes | 147 Views
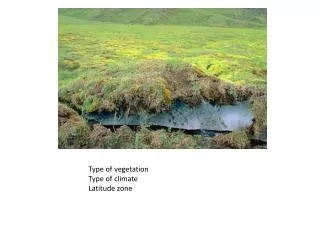
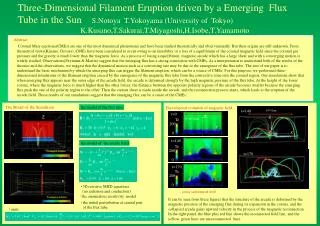
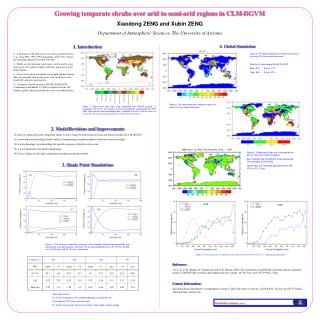
Figure 4. The map of dominant vegetation type at the end of 100-year model simulation. Figure 5. Difference in bare soil coverage at the end of 100-year model simulation. Exp: revised CLM-DGVM with shrub presented. Ctrl: standard CLM-DGVM.

E N D
Figure 4. The map of dominant vegetation type at the end of 100-year model simulation. Figure 5. Difference in bare soil coverage at the end of 100-year model simulation. Exp: revised CLM-DGVM with shrub presented. Ctrl: standard CLM-DGVM. Global bare soil coverage decreases from 46% (Ctrl) to 37% (Exp). EXP CTRL Figure 6. The fraction of vegetation coverage (between 60N~60S) vs. annual precipitation. Growing temperate shrubs over arid to semi-arid regions in CLM-DGVM Xiaodong ZENG and Xubin ZENG Department of Atmospheric Sciences, The University of Arizona 1. Introduction 2. Model Revisions and Improvements In order to realistically grow temperate shrub, we have made the following revisions and improvements of CLM-DGVM: (1) a new function describing shrub’s ability of maintaining its photosynthesis under the stress of drought; (2) a new phenology type describing the quickly response of shrub to rain event; (3) a set of parameters for shrub morphology; (4) a new scheme for the light competition among trees-grasses-shrubs. 3. Single Point Simulations 4. Global Simulation Reference: Levis, S., G.B., Bonan, M. Vertenstein, and K.W. Oleson, 2004: The Community Land Model’s dynamic global vegetation model (CLM-DGVM): technical description and user’s guide. NCAR Tech. Note TN-459+IA, 50pp. Contact Information: Xiaodong Zeng, Department of Atmospheric Sciences, The University of Arizona, 1118E 4th St, Tucson, AZ 85721. Email: xdzeng@atmo.arizona.edu. • A large part of the land surface are arid to semiarid regions (e.g.., from IPCC 1981-1990 climatology, about 27% of land has annual precipitation less than 300 mm). • Shrubs are the dominant vegetations over the arid to semi-arid regions, but cannot compete with trees and grasses in the humid region. • Observations show that shrubs are drought and hot tolerant. They are generally shorter than trees, with small leaves and small LAI, and slow growing rate. • Currently released version of NCAR CLM-DGVM (Community Land Model 3 (CLM 3) coupled with the LPJ dynamic global vegetation model) has not yet included shrubs. Figure 3. The global distribution of temperate shrubs at the end of 100-year model simulation. Fraction of coverage within 60N~60S : Bare: 31% Shrub: 11% Tree: 36% Grass: 22% Figure 1. Global land cover type map (calculated from MODIS product 12, resolution 0.05x0.05) and contour of annual precipitation (calculated from IPCC 1981-1990 monthly mean climatology data, resolution 0.5x0.5. Red line shows the contour for 300 mm of annual precipitation, and blue line for 800 mm) . (A) (B) (C) (D) Figure 2. The history of vegetation coverage at four locations showing the competition and coexistence of shrubs, grasses, and trees. The annual precipitations are: (A) 194 mm; (B) 364 mm; (C) 564 mm; and (D) 757 mm, respectively. Table abbreviations: C3: C3 non-arctic grass; tree: broadleaf deciduous temperate tree. P: precipitation; PFT: plant functional type. FC: fraction of coverage; LAI: leaf area index; Htop: height of top of canopy.