Download

1 / 10
130 likes | 375 Views
The Balmer series is a hydrogen spectral series. The mathematician Johann Jakob Balmer discovered it in 1885. Not to mention, you are aware that it is the second series of the hydrogen spectrum. It signifies the lower energy state of the hydrogen electron for the Balmer series.<br>The hydrogen atoms present in the discharge tube absorb energy from the electric current that flows through it. It causes the excitation of the hydrogen electron from the ground state to one of the higher energy orbits with a quantum number equal to nu22653.

E N D
P R E S E N T A T I O N Balmer series By Jayam chemistry learners
HISTORY OF THE BALMER SERIES Since the 1550s, in the smelting of ores, the flame color served as a qualitative application to identify the chemical substances. Because each chemical element imparts its characteristic color to the flame when heated. HISTORY In 1666, Sir Isaac Newton used this atomic emission phenomenon to study the different colors of sunlight. He used a prism to disperse the sunlight into individual wavelengths. Then Newton kept a screen to display the solar emission lines. To which he named it a spectrum. In 1885, Jakob Balmer discovered an empirical equation to calculate the wavelengths of hydrogen emission lines in the visible region of the hydrogen spectrum. And it is termed the Balmer formula.
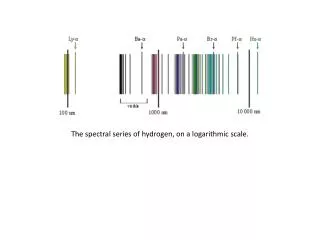
OVERVIEW OF THE BALMER SERIES Balmer is well renowned for his research on the hydrogen spectral series. The part of the hydrogen emission spectrum that corresponds to electron transitions from higher orbicular states n>2 to the energy level with principal quantum number n=2 is a series of spectral lines known as the Balmer series. And the Balmer series consists of a sequence of spectral emissions in both ultraviolet and visible regions of the electromagnetic spectrum. OVERVIEW With the suggestion of Eduard Hagenbach, he utilized Angstrom’s measurements on solar emissions to find a formula for the visible spectral lines of hydrogen. It was popularly known as the Balmer formula. And it computes the wavelengths of the hydrogen emission lines in the visible region.
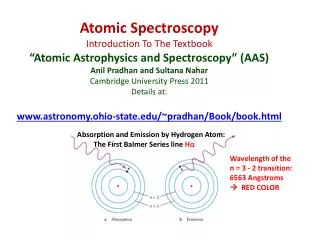
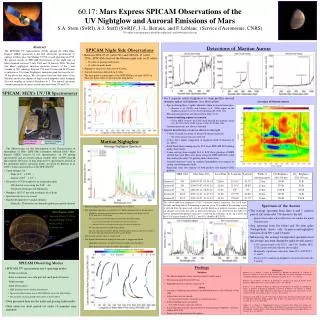
HYDROGEN VISIBLE SPECTRUM HYDROGEN VISIBLE In the visible zone, we observe four spectral lines at wavelengths 656nm, 486nm, 434nm, and 410nm correspond to electron transitions from energy levels such as 3 to 2, 4 to 2, 5 to 2, 6 to 2 giving characteristic red, aqua, blue and violet colored emissions in the hydrogen spectrum. This portion of the Balmer series is also known as the visible hydrogen spectrum. SPECTRUM Out of these four spectral emissions, we observe an intense spectral line during the electron movement from the third energy level to the second level. It is a bright red spectral line in the emission spectra of hydrogen or the ionization nebula.
VISIBLE BALMER SPECTRUM These transitions are also referred to sequentially by Greek letters. The electron transition from the third stationary orbit to the second is known as Hydrogen-alpha or H-α. And Hydrogen beta refers to the electron movement from the fourth main energy level to the second level. The hydrogen gamma spectral line is due to electron transference from the fifth stationary configuration to its early level. Finally, the hydrogen delta spectral line occurs by the electron transition from the sixth orbit to the ground state n=2. VISIBLE BALMER SPECTRUM
UV BALMER SPECTRUM UV BALMER SPECTRUM The electron transitions from the principal quantum number n>6 to the Balmer series ground state n=2 emit spectral lines in the ultraviolet region of the electromagnetic spectrum. Further, Balmer colleagues Wilhelm Vogel and William Huggins confirmed these spectral emissions in the white stars. From the spectral studies, Balmer found that a single wavelength has relation to every spectral line in the visible region of the hydrogen spectrum. And that wavelength is 364.5 nm. Hence, it is also known as the Balmer break.
UV BALMER SPECTRUM The spectral line formed due to the electron transition from the static configuration n=7 to the normal state n=2 is known as hydrogen epsilon. The hydrogen zeta emission line is due to the electron transition from top energy level n=8 to the ground state n=2 at a wavelength of about 389 nm. Similarly, the electron movement from n=9 to n=2 results in a spectral line named hydrogen eta. Finally, the spectral emission that results from n=∞ to the Balmer series ground state n=2 at 364.5 nm is the series limit of the Balmer series. BALMER SPECTRUM ULTRAVIOLET
THE BALMER FORMULA From the history of the Balmer series, we can understand that physicists' experiments on the atomic emission spectrum started in the 1550s. But they lacked an empirical formula to imagine the wavelengths of spectral lines of an element. In 1885, the Balmer equation was the first empirical formula discovered to estimate the wavelengths of spectral emissions in the hydrogen spectrum. THE BALMER FORMULA In 1888, the physicist Johannes Rydberg generalized the Balmer formula with the necessary modifications. The Rydberg formula helps to calculate the wavelengths of all spectral lines that occur in the hydrogen spectrum with the help of an empirical fitting parameter known as the Rydberg constant.
THE MAXIMUM & MINIMUM WAVELENGTHS THE WAVELENGTH OF BALMER SERIES The electron transitions from n ≥3 to n=2 result in the emergence of a sequence of spectral lines in the Balmer series of the hydrogen spectrum. Consequently, the n1 and n2 values of the Balmer series vary from 2 to infinity. The maximum wavelength for the Balmer series is 656 nm, and the minimum wavelength is 364.5 nm. Hence, the limits of the Balmer series are 656 nm and 364.5 nm.
THANK'S FOR WATCHING For more interesting topics on chemistry, follow our instagram page and our blog. Our slideshare page has beautiful infographics and PowerPoint presentations on chemistry concepts. Kindly have a look at it. https://jayamchemistrylearners.blogspot.com/ https://www.instagram.com/chemistrylearners/ https://www.slideshare.net/SaiKalyani11/edit_my_uploads