Download

1 / 1
10 likes | 28 Views
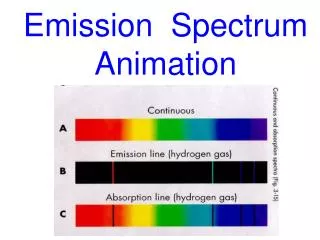
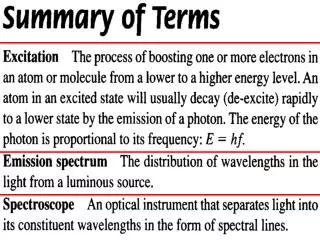
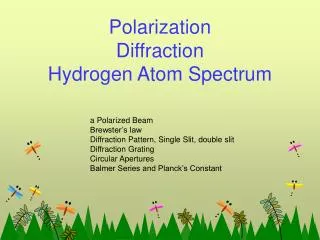
The transition of electrons between the two stationary energy levels with absorption immediately followed by the emission of integrated bundles of quantum results in the appearance of spectral lines in the hydrogen spectrum. Each spectral line corresponds to the emitted photons of discrete frequencies. <br><br>For more information on this concept, kindly visit our blog article at;<br>https://jayamchemistrylearners.blogspot.com/2022/03/hydrogen-spectrum-hydrogen-emission.html

E N D
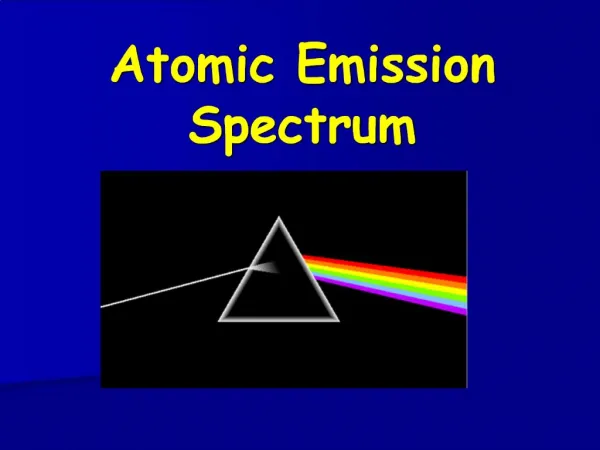
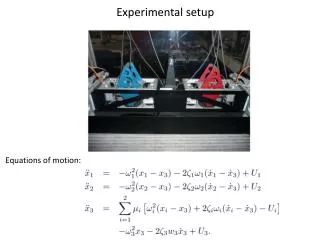
Experimental setup for the hydrogen emission spectrum When the electron intakes either thermal energy or electric energy from an external source, it excites from the ground state to a higher energy state of the atom. Since being unstable, the hydrogen electron returns to its initial lower energy state with the emission of photons of suitable wavelength. It results in the emergence of spectral lines in the atomic spectrum of hydrogen. Consider a sample of hydrogen gas in the glass discharge tube. The electric current is passed through the hydrogen gas present in the discharge tube under low pressure. When the hydrogen atoms absorb energy from the electric discharge, they get excited to higher energy states. And the unsettled electron in the excited state then returns to its initial position with the emission of photons of suitable wavelengths. Now, the hydrogen gas in the discharge tube glows red indicating the electron transition between the two different energy levels. And the emitted light radiations is passed through the slit And then the emitted light is made to fall on the glass prism that separates the light radiation into constituent wavelengths Slit Finally, the photographic plate placed over there records the line emission spectrum of hydrogen. Hydrogen spectrum The hydrogen spectrum contains a set of lines in the ultraviolet, visible and infrared regions. And the wavelengths of lines obtained below 400nm falls in the ultraviolet part of the electromagnetic spectrum. Similarly, wavelengths of lines obtained above 700nm are in the infrared zone. Visible IR UV Regions of hydrogen spectrum Blog: https://jayamchemistrylearners.blogspot.com/