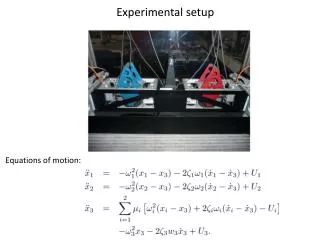
Experimental setup
group II G T 17-32h. group II Tcd 17-32h. group II Tcd 17-32h. group II G T 17-32h. group II Tc 17-32h. group II G T 17-32h. group III G T 33h. group III Tcd 33h. group III Tcd 33h. group III G T 33h. group III Tcd 33h. group III G T 33h. group I G T 16h.

Experimental setup
E N D
Presentation Transcript
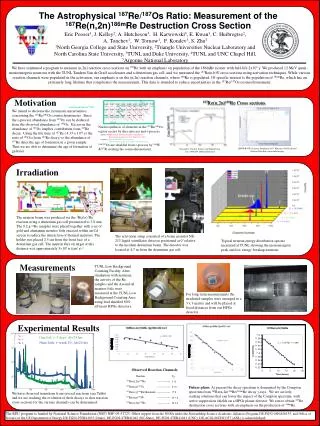
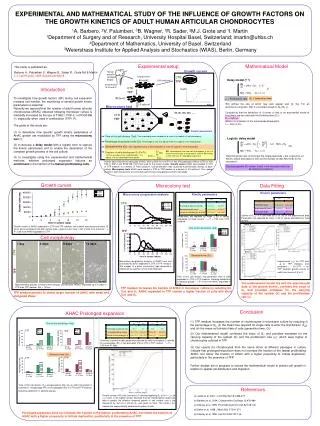
group II GT 17-32h group II Tcd 17-32h group II Tcd 17-32h group II GT 17-32h group II Tc 17-32h group II GT 17-32h group III GT 33h group III Tcd33h group III Tcd33h group III GT 33h group III Tcd33h group III GT 33h group I GT 16h group I GT 16h group I GT 16h group I Tcd16h group I Tcd16h groupI Tcd16h 16h 16h 17-32h 17-32h 33h 33h dN N(t) dN K dt dt Ncells C A B E F D G M I L H N 1 cell 2 cells 4 cells Percentage of cells Percentage of cells * Percentage of cells Percentage of cells * CTR TFP Experimental setup Mathematical Model This study is published as: Barbero A., Palumberi V., Wagner B., Sader R., Grote MJ & Martin I. J Cell Physiol. 2005 Sep;204(3):830-8 Growth curves EXPERIMENTAL AND MATHEMATICAL STUDY OF THE INFLUENCE OF GROWTH FACTORS ON THE GROWTH KINETICS OF ADULT HUMAN ARTICULAR CHONDROCYTES ¹A. Barbero, ²V. Palumberi, 3B. Wagner, ¹R. Sader, ²M.J. Grote and ¹I. Martin¹Department of Surgery and of Research, University Hospital Basel, Switzerland; imartin@uhbs.ch²Department of Mathematics, University of Basel, Switzerland3Weierstrass Institute for Applied Analysis and Stochastics (WIAS), Berlin, Germany Human articular cartilage biopsy expansion CTR Delay model (d, e) P1 AHAC 1000 cells/cm2 TFP three donors (A, B and C) = N(t - GT); t 0 CTR Introduction (I) TFP N(t) = Ψ(t), - GT t < 0 To investigate how growth factors (GF) during cell expansion increase cell number, the monitoring of several growth kinetic parameters is essential. Recently we reported that the number of adult human articular chondrocytes (AHAC) obtained following monolayer culture is markedly increased by the use of TGFb1, FGF-2, or PDGF-BB (a), especially when used in combination (TFP) (b). The goals of this study are: (1) to determine how specific growth kinetic parameters of AHAC growth are modulated by TFP using the microcolony test (c); (2) to develop a delay model with a logistic term to capture the kinetic parameters and to enable the description of the complete growth process of the cell culture; (3) to investigate using the experimental and mathematical methods,whether prolonged expansion induces an enrichment in the fraction of the fastest proliferating cells. P2 AHAC GT = Generation time = Proliferation rate Ψ(t) defines the rate at which new cells appear over [0, GT]. For an asynchronous growth, Ψ(t) is a constant equals to N0 /(GT). Considering that the behaviour of (I) tends to that of an exponential model at long times, we can calculate the Doubling time (DT): DT = ln(2)/ where is a solution of the transcendental equation = exp(-GT) days 2.5 cells/cm2 Microcolony test 0h, 8h, 16h, 24h, ..... CTR TFP Kinetic parameters Time of first cell division (Tcd): Time required by each seeded cell to reach the stage of a 2-cell microcolony Logistic delay model Percentage of quiescent cells (Qc): Percentage of cells that did not reach the stage of 2-cell microcolonies = N(t - GT) 1 - ; t>0, N(0) = N0 (III) Generation time (GT): Time required by each 2-cell microcolony to reach the stage of a 4-cell microcolony N(t) = Ψ(t), - GT t < 0 DFi: ratio between the new cells that appear in the i-th interval and the cells at the previous interval; N: number of time intervals; T : total observation time Fraction of cells dividing per GT (Fc(T)): Fc(T) is an index of the ''exponentiality'’: it is equals 1 for an ideal exponential growth Here the growth rate is no longer the single parameter but is given by(1 - N(t)/K), which decreases to zero as the number of cells N(t) tends to the constant K. Human adult articular chondrocytes (AHAC) were culture for one (P1) or two (P2) passages without (CTR) or with TGF-, FGF-2 and PDGF-BB (TFP) and used for the kinetic studies. Growth curves AHAC were seeded in CTR or TFP medium at a density of 1000 cells/cm2. Cell proliferation was assessed fluorimetrically during 12 days' culture. Microcolony testsAHAC were seeded in CTR or TFP medium at a density of 2.5 cells/cm2. The number of cells in each microcolony was counted each 8 hours using phase contrast microscopy Carrying capacity (K): number of cells in the monolayer which can be reached at confluence Growth curves Microcolony test Data Fitting * * * Kinetic parameters Microcolony progression analysis * Kinetic parameters * * CTR * * Values of GT, or K are fitted by (I) or (III) to the experimental data. Parameters are reported as mean ± SD of values calculated for three donors Parameters are reported as mean ± SD of values calculated for three donors .* = P < 0.05 from CTR medium. Donor A Donor B Growth curves of AHAC expanded in CTR and TFP medium; cell number was measured every 12 hours and normalized to the dish surface area; values are the mean ± SD of cells from 3 donors. * = P< 0.05 from AHAC expanded in CTR. Time of first cell division (Tcd) CTR TFP TFP Cell morphology * 1 day 4 days 8 days 12 days Donor C CTR Generation time (GT) Microcolony progression analysis of AHAC from one characteristic donor expanded in CTR or TFP medium. The number of a given microcolony type observed is expressed as a percent of the total observed. Experimental ( for CTR and TF for TFP medium) and predicted (--- for CTR, — for TFP medium) growth curves of cells from donors A, B or C TFP Time of first cell division and generation time of cells expanded in CTR or TFP medium, following subdivision in arbitrary groups. * = P< 0.05 from AHAC expanded in CTR The mathematical model fits well the experimental data of the growth kinetic, confirms the value of GT and provides estimates for the carrying capacity of the system (K) and the proliferation rate () Representative pictures of adult human articular chondrocytes (AHAC) expandedup to 12 days in CTR andr TFP medium. Bar = 100mm. TFP medium increases the number of AHAC in monolayer culture by reducing Qc, Tcd, and GT. AHAC expanded in TFP contain a higher fraction of cells with short Tcd and GT TFP medium permits to obtain larger number of AHAC with small and elongated shape Conclusion AHAC Prolonged expansion (1) TFP medium increases the number of chondrocytes in monolayer culture by reducing (i) the percentage of Qc, (ii) the mean time required for single cells to enter the first division (Tcd), and (iii) the mean cell division time of cells (generation time, GT) Time of first cell division (Tcd) p1 p1 CTR TFP p2 p2 (2) Our mathematical model confirmed the value of GT and provided estimates for the carrying capacity of the system (K) and the proliferation rate (), which were higher in chondrocytes cultured in TFP Summary of growth kinetic parameters derived for cells from patient C cultured for one passage (P1) or two passages (P2) in CTR or TFP medium. * = P < 0.05 from P1 cells. (3) Our results for chondrocytes from the same donor at different passages in culture indicate that prolonged expansion does not increase the fraction of the fastest proliferating AHAC, but rather the fraction of AHAC with a higher propensity to initiate duplication, particularly in the presence of TFP. Generation time (GT) TFP CTR Further studies are in progress to extend the mathematical model to predict cell growth in relation to spatial cell distribution and migration. Time of first cell division (Tcd) and generation time (GT) in cells from patient C cultured for one passage (P1) or two passages (P2) in CTR and TFP medium, following subdivision in arbitrary groups. References Growth curves of P2 cells from donor C obtained applying GT of 16 (‑‑‑) or 26 (—) hours in the logistic model. Describe that the mathematical model was able to predict the effective temporal growth in cell number only if the measured GT, but not a shorter GT, was given as input. The circles ( F ) indicate the experimentally determined number of cells. (a) Jakob et al. 2001. J Cell Biochem 81:368-377 (b) Barbero et al. 2004. Osteoarthritis Cartilage 12:476-484 (c) Sherley et al. 1995. Proc Natl Acad Sci USA 92:136-140 (d) Baker et al. 1998. J Math Biol 37:341-371 (e) Sherley et al. 1995. Cell Prolif 28:137-144. Prolonged expansion does not increase the fraction of the fastest proliferating AHAC, but rather the fraction of AHAC with a higher propensity to initiate duplication, particularly in the presence of TFP