Download

1 / 25
250 likes | 291 Views
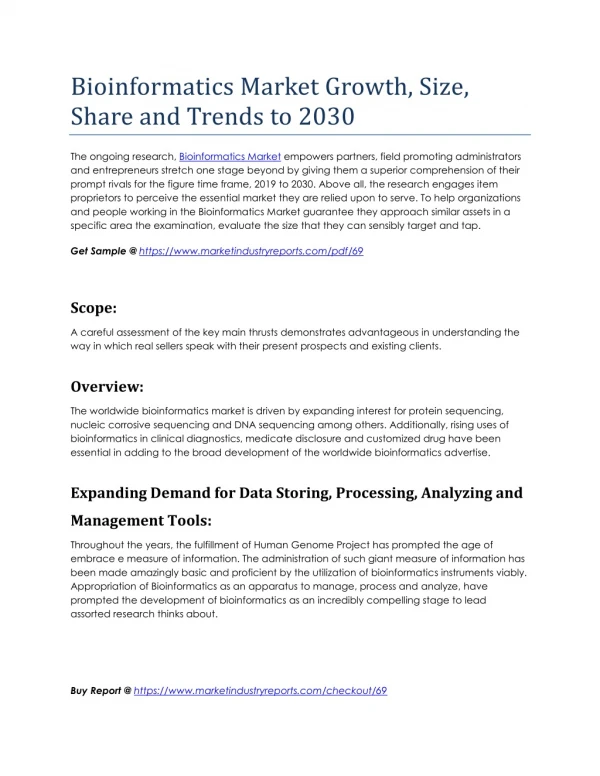
Mono Ethylene Glycol (MEG) is a versatile industrial chemical with high demand owing to its properties such as high durability, hydrophobic nature, and extreme tenacity. It is keenly used as a key ingredient or as a feedstock for manufacturing a variety of products such as Polyester Fibres, Polyester Films, Polyethylene Terephthalate (PET), antifreeze products, Coolants, solvents, etc.

E N D
Mono Ethylene Glycol (MEG) Market Analysis: Plant Capacity, Production, Operating Efficiency, Technology, Demand & Supply, Application, Distribution Channel, Regional Demand, 2015-2030 Mono Ethylene Glycol Market has witnessed a demand of 27.64 million tons in 2020 and the market is anticipated to grow at a significant rate with a healthy CAGR of 4.60% through the forecast period 2030. [Online Quarterly Update] The Mono Ethylene Glycol market witnessed a demand of 27.64 million tons in 2020 and is anticipated to grow at a healthy CAGR of 4.60% through the forecast period, 2030. MEG is a slightly viscous, colorless, odorless organic compound with a sweet taste. It is also known as 1,2- ethanediol and is soluble with most of the organic compounds, alcohols and water. It is mainly produced by Ethylene via Ethylene Oxide hydrolysis along with the release of two co-products, Diethylene Glycol (DEG) and Triethylene Glycol (TEG). The feedstocks used for the production of MEG are natural gas, coal, naphtha and bioethanol; hence its market is segmented into 4 types on the basis of the aforementioned sources from which it is derived. Among these, natural gas holds the major share for MEG production followed by Naphtha and Coal. Though due to rising environmental concerns to reduce the carbon footprint, the majority of the manufacturers are now focusing to shift toward the production of biobased Mono Ethylene Glycol instead of petrochemical-based MEG. Read Full Report Here: https://www.chemanalyst.com/industry-report/mono-ethylene- glycol-meg-market-646 Mono Ethylene Glycol (MEG) is a versatile industrial chemical with high demand owing to its properties such as high durability, hydrophobic nature, and extreme tenacity. It is keenly used as a key ingredient or as a feedstock for manufacturing a variety of products such as Polyester Fibres, Polyester Films, Polyethylene Terephthalate (PET), antifreeze products, Coolants, solvents, etc. Additionally, it is employed in paper, printing inks, leather, fibres treatment and cellophane industries due to its
humectant nature. Based on its applications, MEG market is segmented into two grades i.e. Polyester and Non-Polyester Grades. Owing to all these applications, the major end use industries of MEG are Textile, Packaging, Cosmetics, Pharmaceuticals, Food and Beverage, Automobile, Chemicals, Adhesives & Sealants, and Others. Most of the MEG produced globally is utilized in the production of Polyester Fibers followed by Polyethylene Terephthalate (PET) and Polyester films. The major restraint in the market for Mono Ethylene Glycol is the fluctuation in the prices of Petrochemicals as majority of the MEG is produced by Petrochemicals as its feedstock. In the first half of 2020, due to the spread of COVID-19 across the globe, major economies had imposed nationwide lockdowns, which impacted most of the industries as industries and refineries went non- operational following government’s regulations. There was a decline in the demand of Mono Ethylene Glycol (MEG) due to the dip in the production and demand of various derivatives and end products. There was a slump in sectors such as Textile, Food and Beverages, Chemicals, Automobile which consequently hit the market for MEG amid COVID-19 crisis.However, an improvement is witnessed by the end of 2020 as industries start operating their manufacturing units at maximum efficiencies and establishing new units following increasing demand for MEG, globally. Years Considered for this Report: Historical Years: 2015 – 2019 Base Year: 2020 Estimated Year: 2021 Forecast Period: 2022 – 2030 Objective of the Study: • The primary objective of the study was to evaluate and forecast the Mono Ethylene Glycol capacity, production, demand, inventory, and demand–supply gap globally. To categorize Mono Ethylene Glycol demand based on Application, Type, region, and distribution channel To identify major customers of Mono Ethylene Glycol globally. To evaluate and forecast Mono Ethylene Glycol pricing globally. To identify and profile major companies operating globally Mono Ethylene Glycol market. To identify major news, deals and expansion plans globally Mono Ethylene Glycol market. • • • • • Regional Outlook:
Region wise, Asia Pacific accounted for the major share of the Mono Ethylene Glycol market, globally. Rapid industrialization, growing population as well as China being the leading manufacturer of various derivatives of MEG are the key factors that are going to fuel the growth of Mono Ethylene Glycol Market in the forecast period. Additionally, flourishing industries like Packaging, Pharmaceuticals and Food and Beverage in the region are also positively influencing the growth of the Mono Ethylene Glycol market. Moreover, countries like China and India are the leading textile manufacturer, globally. Therefore, application of MEG in fiber is also likely to boost its demand in Asia Pacific over the forecast period. In terms of regional analysis, North America is anticipated to grow at a promising rate in the forecast period due to the presence of petrochemicals (raw material) in abundance such as natural gas. Key Players: ➢SABIC ➢ExxonMobil Corporation ➢Mitsubishi Chemical ➢Formosa ➢Chemtex Speciality Limited ➢The Dow Chemicals ➢LyondellBasell Industries ➢Royal Dutch Shell ➢AkzoNobel ➢MEGlobal ➢Reliance Industries ➢Lotte Chemical Corporation ➢Nan Ya Plastics Corporation ➢China Petroleum and Chemical Corporation ➢India Glycols and Sinopec Zhenhai Refining & Chemical Co.\ To extract data for Global Mono Ethylene Glycol market, primary research surveys were conducted with Mono Ethylene Glycol manufacturers, suppliers, distributors, wholesalers and end users. While interviewing, the respondents were also inquired about their competitors. Through this technique, Chemanol’s was able to include manufacturers that could not be identified due to the limitations of secondary research. Moreover, chemicals analyzed various end user segments and projected a positive outlook for Global Mono Ethylene Glycol market over the coming years. ChemAnalyst calculated Mono Ethylene Glycol demand globally by analyzing the historical data and demand forecast which was carried out considering the Application industries growth. ChemAnalyst sourced these values from industry experts and company representatives and externally validated through analyzing historical sales data of respective manufacturers to arrive at the overall market size. Various secondary sources such as company websites, association reports, annual reports, etc., were also studied by ChemAnalyst. Key Target Audience • • • • Mono Ethylene Glycol manufacturers and other stakeholders Organizations, forums and alliances related to Mono Ethylene Glycol distribution Government bodies such as regulating authorities and policy makers Market research organizations and consulting companies The study is useful in providing answers to several critical questions that are important for industry stakeholders, such as Mono Ethylene Glycol manufacturers, distributors and policymakers. The report also provides useful insights about which market segments should be targeted over the coming years to strategize investments and capitalize on growth opportunities.
Report Scope: In this report, the Global Mono Ethylene Glycol market has been segmented into following categories, in addition to the industry trends which have also been detailed below: Attribute Details 27.64 million Tons Market size Volume in 2020 Growth Rate CAGR of 4.60% from 2021 to 2030 Base year for estimation 2020 Historic Data 2015 – 2019 Forecast period 2021 – 2030 Quantitative units Revenue in USD million/billion and CAGR from 2021 to 2030 Report coverage Revenue forecast, demand & supply, competitive analysis, competitive landscape, growth factors, and trends Segments covered • • Type (Natural Gas, Coal, Naphtha & Bioethanol) Application (Polyester Fiber, PET, Polyester Film, Antifreeze agent or Deicer, Coolants and Others) Distribution Channel (Direct/Institutional Sales, Other Channel Sales) Region • • Regional scope North America; Europe; Asia Pacific; South America; Middle East & Africa Country scope United States; Mexico; Canada; China; India; Japan; South Korea; Taiwan; Singapore; Germany; Belgium; France; United Kingdom; Spain; Italy; Sweden; Austria; Saudi Arabia; Iran; South Africa; Brazil; Argentina Key companies profiled SABIC, ExxonMobil Corporation, Mitsubishi Chemical, Formosa, Chemtex Speciality Limited, The Dow Chemicals, LyondellBasell Industries, Royal Dutch Shell, AkzoNobel, MEGlobal, Reliance Industries, Lotte Chemical Corporation, Nan Ya Plastics Corporation, China Petroleum and Chemical Corporation, India Glycols and Sinopec Zhenhai Refining & Chemical Co. Customization scope Free report customization with purchase. Addition or alteration to country, regional & segment scope. Pricing and purchase options Avail customized purchase options to meet your exact research needs. Explore purchase options
TABLE OF CONTENTS 1. Global Mono Ethylene Glycol Market Outlook, 2015-2030 1.1. Capacity, By Volume 1.1.1. By Company 1.2. Production, By Volume 1.2.1. By Company 1.3. Operating Efficiency 1.3.1. By Company 2. Global Mono Ethylene Glycol Demand Outlook, 2015-2030, By Volume 2.1. By Type 2.2. By Application 2.3. By Region 2.4. By Company 2.5. By Sales channel 3. North America Mono Ethylene Glycol Market Outlook, 2015-2030 3.1. Capacity, By Volume 3.1.1. By Country 3.2. Production 3.2.1. By Country 3.3. Operating Efficiency 3.3.1. By Country 4. North America Mono Ethylene Glycol Demand Outlook, 2015-2030, By Volume 4.1. By Type 4.2. By Application
4.3. By Country 4.4. United States Mono Ethylene Glycol Market Outlook, 2015-2030 4.4.1. Capacity, By Volume 4.4.1.1. By Company 4.4.1.2. By Location 4.4.2. Production 4.4.2.1. By Company 4.4.3. Operating Efficiency 4.4.3.1. By Company 4.4.4. United States Mono Ethylene Glycol Demand-Supply Scenario, 2015-2030, By Volume 4.4.4.1. Demand 4.4.4.2. Supply 4.4.4.3. Gap 4.4.5. United States Mono Ethylene Glycol Demand Outlook, 2015-2030, By Volume 4.4.5.1. By Type 4.4.5.2. By Application 4.4.5.3. By Company Share (At least top 3 companies’ market share) 4.4.5.4. By Region 4.4.5.5. By Sales Channel 4.5. Mexico Mono Ethylene Glycol Market Outlook, 2015-2030 4.5.1. Capacity, By Volume 4.5.1.1. By Company 4.5.1.2. By Location 4.5.2. Production
4.5.2.1. By Company 4.5.3. Operating Efficiency 4.5.3.1. By Company 4.5.4. Mexico Mono Ethylene Glycol Demand-Supply Scenario, 2015-2030, By Volume 4.5.4.1. Demand 4.5.4.2. Supply 4.5.4.3. Gap 4.5.5. Mexico Mono Ethylene Glycol Demand Outlook, 2015-2030, By Volume 4.5.5.1. By Type 4.5.5.2. By Application 4.5.5.3. By Company Share (At least top 3 companies’ market share) 4.5.5.4. By Region 4.5.5.5. By Sales Channel 4.6. Canada Mono Ethylene Glycol Market Outlook, 2015-2030 4.6.1. Capacity, By Volume 4.6.1.1. By Company 4.6.1.2. By Location 4.6.2. Production 4.6.2.1. By Company 4.6.3. Operating Efficiency 4.6.3.1. By Company 4.6.4. Canada Mono Ethylene Glycol Demand-Supply Scenario, 2015-2030, By Volume 4.6.4.1. Demand 4.6.4.2. Supply
4.6.4.3. Gap 4.6.5. Canada Mono Ethylene Glycol Demand Outlook, 2015-2030, By Volume 4.6.5.1. By Type 4.6.5.2. By Application 4.6.5.3. By Company Share (At least top 3 companies’ market share) 4.6.5.4. By Region 4.6.5.5. By Sales Channel 5. Asia Pacific Mono Ethylene Glycol Market Outlook, 2015-2030 5.1. Capacity, By Volume 5.1.1. By Country 5.2. Production 5.2.1. By Country 5.3. Operating Efficiency 5.3.1. By Country 6. Asia Pacific Mono Ethylene Glycol Demand Outlook, 2015-2030, By Volume 6.1. By Type 6.2. By Application 6.3. By Country 6.4. China Mono Ethylene Glycol Market Outlook, 2015-2030 6.4.1. Capacity, By Volume 6.4.1.1. By Company 6.4.1.2. By Location 6.4.2. Production 6.4.2.1. By Company
6.4.3. Operating Efficiency 6.4.3.1. By Company 6.4.4. China Mono Ethylene Glycol Demand-Supply Scenario, 2015-2030, By Volume 6.4.4.1. Demand 6.4.4.2. Supply 6.4.4.3. Gap 6.4.5. China Mono Ethylene Glycol Demand Outlook, 2015-2030, By Volume 6.4.5.1. By Type 6.4.5.2. By Application 6.4.5.3. By Company Share (At least top 3 companies’ market share) 6.4.5.4. By Region 6.4.5.5. By Sales Channel 6.5. India Mono Ethylene Glycol Market Outlook, 2015-2030 6.5.1. Capacity, By Volume 6.5.1.1. By Company 6.5.1.2. By Location 6.5.2. Production 6.5.2.1. By Company 6.5.3. Operating Efficiency 6.5.3.1. By Company 6.5.4. India Mono Ethylene Glycol Demand-Supply Scenario, 2015-2030, By Volume 6.5.4.1. Demand 6.5.4.2. Supply 6.5.4.3. Gap
6.5.5. India Mono Ethylene Glycol Demand Outlook, 2015-2030, By Volume 6.5.5.1. By Type 6.5.5.2. By Application 6.5.5.3. By Company Share (At least top 3 companies’ market share) 6.5.5.4. By Region 6.5.5.5. By Sales Channel 6.6. Japan Mono Ethylene Glycol Market Outlook, 2015-2030 6.6.1. Capacity, By Volume 6.6.1.1. By Company 6.6.1.2. By Location 6.6.2. Production 6.6.2.1. By Company 6.6.3. Operating Efficiency 6.6.3.1. By Company 6.6.4. Japan Mono Ethylene Glycol Demand-Supply Scenario, 2015-2030, By Volume 6.6.4.1. Demand 6.6.4.2. Supply 6.6.4.3. Gap 6.6.5. Japan Mono Ethylene Glycol Demand Outlook, 2015-2030, By Volume 6.6.5.1. By Type 6.6.5.2. By Application 6.6.5.3. By Company Share (At least top 3 companies’ market share) 6.6.5.4. By Region 6.6.5.5. By Sales Channel
6.7. South Korea Mono Ethylene Glycol Market Outlook, 2015-2030 6.7.1. Capacity, By Volume 6.7.1.1. By Company 6.7.1.2. By Location 6.7.2. Production 6.7.2.1. By Company 6.7.3. Operating Efficiency 6.7.3.1. By Company 6.7.4. South Korea Mono Ethylene Glycol Demand-Supply Scenario, 2015-2030, By Volume 6.7.4.1. Demand 6.7.4.2. Supply 6.7.4.3. Gap 6.7.5. South Korea Mono Ethylene Glycol Demand Outlook, 2015-2030, By Volume 6.7.5.1. By Type 6.7.5.2. By Application 6.7.5.3. By Company Share (At least top 3 companies’ market share) 6.7.5.4. By Region 6.7.5.5. By Sales Channel 6.8. Taiwan Mono Ethylene Glycol Market Outlook, 2015-2030 6.8.1. Capacity, By Volume 6.8.1.1. By Company 6.8.1.2. By Location 6.8.2. Production 6.8.2.1. By Company
6.8.3. Operating Efficiency 6.8.3.1. By Company 6.8.4. Taiwan Mono Ethylene Glycol Demand-Supply Scenario, 2015-2030, By Volume 6.8.4.1. Demand 6.8.4.2. Supply 6.8.4.3. Gap 6.8.5. Taiwan Mono Ethylene Glycol Demand Outlook, 2015-2030, By Volume 6.8.5.1. By Type 6.8.5.2. By Application 6.8.5.3. By Region 6.8.5.4. By Sales Channel 6.8.5.5. By Company Share (At least top 3 companies’ market share) 6.9. Singapore Mono Ethylene Glycol Market Outlook, 2015-2030 6.9.1. Capacity, By Volume 6.9.1.1. By Company 6.9.1.2. By Location 6.9.2. Production 6.9.2.1. By Company 6.9.3. Operating Efficiency 6.9.3.1. By Company 6.9.4. Singapore Mono Ethylene Glycol Demand-Supply Scenario, 2015-2030, By Volume 6.9.4.1. Demand 6.9.4.2. Supply 6.9.4.3. Gap
6.9.5. Singapore Mono Ethylene Glycol Demand Outlook, 2015-2030, By Volume 6.9.5.1. By Type 6.9.5.2. By Application 6.9.5.3. By Region 6.9.5.4. By Sales Channel 6.9.5.5. By Company Share (At least top 3 companies’ market share) 7. Europe Mono Ethylene Glycol Market Outlook, 2015-2030 7.1. Capacity, By Volume 7.1.1. By Country 7.2. Production 7.2.1. By Country 7.3. Operating Efficiency 7.3.1. By Country 8. Europe Mono Ethylene Glycol Demand Outlook, 2015-2030, By Volume 8.1. By Type 8.2. By Application 8.3. By Sales Channel (Direct/Institutional Sales, Retail Sales, Other Channel Sales) 8.4. By Country 8.5. Germany Mono Ethylene Glycol Market Outlook, 2015-2030 8.5.1. Capacity, By Volume 8.5.1.1. By Company 8.5.1.2. By Location 8.5.2. Production 8.5.2.1. By Company
8.5.3. Operating Efficiency 8.5.3.1. By Company 8.5.4. Germany Mono Ethylene Glycol Demand-Supply Scenario, 2015-2030, By Volume 8.5.4.1. Demand 8.5.4.2. Supply 8.5.4.3. Gap 8.5.5. Germany Mono Ethylene Glycol Demand Outlook, 2015-2030, By Volume 8.5.5.1. By Type 8.5.5.2. By Application 8.5.5.3. By Company Share (At least top 3 companies’ market share) 8.5.5.4. By Region 8.5.5.5. By Sales Channel 8.5.6. Belgium Mono Ethylene Glycol Market Outlook, 2015-2030 8.5.6.1. Capacity, By Volume 8.5.6.1.1. By Company 8.5.6.1.2. By Location 8.5.6.2. Production 8.5.6.2.1. By Company 8.5.6.3. Operating Efficiency 8.5.6.3.1. By Company 8.5.7. Belgium Mono Ethylene Glycol Demand-Supply Scenario, 2015-2030, By Volume 8.5.7.1. Demand 8.5.7.2. Supply 8.5.7.3. Gap
8.5.8. Belgium Mono Ethylene Glycol Demand Outlook, 2015-2030, By Volume 8.5.8.1. By Type 8.5.8.2. By Application 8.5.8.3. By Sales Channel 8.5.8.4. By Company Share (At least top 3 companies’ market share) 8.5.8.5. By Region 8.6. France Mono Ethylene Glycol Market Outlook, 2015-2030 8.6.1. Capacity, By Volume 8.6.1.1. By Company 8.6.1.2. By Location 8.6.2. Production 8.6.2.1. By Company 8.6.3. Operating Efficiency 8.6.3.1. By Company 8.6.4. France Mono Ethylene Glycol Demand-Supply Scenario, 2015-2030, By Volume 8.6.4.1. Demand 8.6.4.2. Supply 8.6.4.3. Gap 8.6.5. France Mono Ethylene Glycol Demand Outlook, 2015-2030, By Volume 8.6.5.1. By Type 8.6.5.2. By Application 8.6.5.3. By Sales Channel 8.6.5.4. By Company Share (At least top 3 companies’ market share) 8.6.5.5. By Region
8.7. United Kingdom Mono Ethylene Glycol Market Outlook, 2015-2030 8.7.1. Capacity, By Volume 8.7.1.1. By Company 8.7.1.2. By Location 8.7.2. Production 8.7.2.1. By Company 8.7.3. Operating Efficiency 8.7.3.1. By Company 8.7.4. United Kingdom Mono Ethylene Glycol Demand-Supply Scenario, 2015-2030, By Volume 8.7.4.1. Demand 8.7.4.2. Supply 8.7.4.3. Gap 8.7.5. United Kingdom Mono Ethylene Glycol Demand Outlook, 2015-2030, By Volume 8.7.5.1. By Type 8.7.5.2. By Application 8.7.5.3. By Sales Channel 8.7.5.4. By Company Share (At least top 3 companies’ market share) 8.7.5.5. By Region 8.8. Spain Mono Ethylene Glycol Market Outlook, 2015-2030 8.8.1. Capacity, By Volume 8.8.1.1. By Company 8.8.1.2. By Location 8.8.2. Production 8.8.2.1. By Company
8.8.3. Operating Efficiency 8.8.3.1. By Company 8.8.4. Spain Mono Ethylene Glycol Demand-Supply Scenario, 2015-2030, By Volume 8.8.4.1. Demand 8.8.4.2. Supply 8.8.4.3. Gap 8.8.5. Spain Mono Ethylene Glycol Demand Outlook, 2015-2030, By Volume 8.8.5.1. By Type 8.8.5.2. By Application 8.8.5.3. By Sales Channel 8.8.5.4. By Company Share (At least top 3 companies’ market share) 8.8.5.5. By Region 8.9. Italy Mono Ethylene Glycol Market Outlook, 2015-2030 8.9.1. Capacity, By Volume 8.9.1.1. By Company 8.9.1.2. By Location 8.9.2. Production 8.9.2.1. By Company 8.9.3. Operating Efficiency 8.9.3.1. By Company 8.9.4. Italy Mono Ethylene Glycol Demand-Supply Scenario, 2015-2030, By Volume 8.9.4.1. Demand 8.9.4.2. Supply 8.9.4.3. Gap
8.9.5. Italy Mono Ethylene Glycol Demand Outlook, 2015-2030, By Volume 8.9.5.1. By Type 8.9.5.2. By Application 8.9.5.3. By Sales Channel 8.9.5.4. By Company Share (At least top 3 companies’ market share) 8.9.5.5. By Region 8.10. Sweden Mono Ethylene Glycol Market Outlook, 2015-2030 8.10.1. Capacity, By Volume 8.10.1.1. By Company 8.10.1.2. By Location 8.10.2. Production 8.10.2.1. By Company 8.10.3. Operating Efficiency 8.10.3.1. By Company 8.10.4. Sweden Mono Ethylene Glycol Demand-Supply Scenario, 2015-2030, By Volume 8.10.4.1. Demand 8.10.4.2. Supply 8.10.4.3. Gap 8.10.5. Sweden Mono Ethylene Glycol Demand Outlook, 2015-2030, By Volume 8.10.5.1. By Type 8.10.5.2. By Application 8.10.5.3. By Sales Channel 8.10.5.4. By Company Share (At least top 3 companies’ market share) 8.10.5.5. By Region
8.11. Austria Mono Ethylene Glycol Market Outlook, 2015-2030 8.11.1. Capacity, By Volume 8.11.1.1. By Company 8.11.1.2. By Location 8.11.2. Production 8.11.2.1. By Company 8.11.3. Operating Efficiency 8.11.3.1. By Company 8.11.4. Austria Mono Ethylene Glycol Demand-Supply Scenario, 2015-2030, By Volume 8.11.4.1. Demand 8.11.4.2. Supply 8.11.4.3. Gap 8.11.5. Austria Mono Ethylene Glycol Demand Outlook, 2015-2030, By Volume 8.11.5.1. By Type 8.11.5.2. By Application 8.11.5.3. By Sales Channel 8.11.5.4. By Company Share (At least top 3 companies’ market share) 8.11.5.5. By Region 9. MEA Mono Ethylene Glycol Market Outlook, 2015-2030 9.1. Capacity, By Volume 9.1.1. By Country 9.2. Production 9.2.1. By Country 9.3. Operating Efficiency
9.3.1. By Country 10. MEA Mono Ethylene Glycol Demand Outlook, 2015-2030, By Volume 10.1. By Type 10.2. By Application 10.3. By Sales Channel 10.4. By Country 10.5. Saudi Arabia Mono Ethylene Glycol Market Outlook, 2015-2030 10.5.1. Capacity, By Volume 10.5.1.1. By Company 10.5.1.2. By Location 10.5.2. Production 10.5.2.1. By Company 10.5.3. Operating Efficiency 10.5.3.1. By Company 10.5.4. Saudi Arabia Mono Ethylene Glycol Demand-Supply Scenario, 2015-2030, By Volume 10.5.4.1. Demand 10.5.4.2. Supply 10.5.4.3. Gap 10.5.5. Saudi Arabia Mono Ethylene Glycol Demand Outlook, 2015-2030, By Volume 10.5.5.1. By Type 10.5.5.2. By Application 10.5.5.3. By Sales Channel 10.5.5.4. By Company Share (At least top 3 companies’ market share) 10.5.5.5. By Region
10.6. Iran Mono Ethylene Glycol Market Outlook, 2015-2030 10.6.1. Capacity, By Volume 10.6.1.1. By Company 10.6.1.2. By Location 10.6.2. Production 10.6.2.1. By Company 10.6.3. Operating Efficiency 10.6.3.1. By Company 10.6.4. Iran Mono Ethylene Glycol Demand-Supply Scenario, 2015-2030, By Volume 10.6.4.1. Demand 10.6.4.2. Supply 10.6.4.3. Gap 10.6.5. Iran Mono Ethylene Glycol Demand Outlook, 2015-2030, By Volume 10.6.5.1. By Type 10.6.5.2. By Application 10.6.5.3. By Sales Channel 10.6.5.4. By Company Share (At least top 3 companies’ market share) 10.6.5.5. By Region. 10.7. South Africa Mono Ethylene Glycol Market Outlook, 2015-2030 10.7.1. Capacity, By Volume 10.7.1.1. By Company 10.7.1.2. By Location 10.7.2. Production 10.7.2.1. By Company
10.7.3. Operating Efficiency 10.7.3.1. By Company 10.7.4. South Africa Mono Ethylene Glycol Demand-Supply Scenario, 2015-2030, By Volume 10.7.4.1. Demand 10.7.4.2. Supply 10.7.4.3. Gap 10.7.5. South Africa Mono Ethylene Glycol Demand Outlook, 2015-2030, By Volume 10.7.5.1. By Type 10.7.5.2. By Application 10.7.5.3. By Sales Channel 10.7.5.4. By Company Share (At least top 3 companies’ market share) 10.7.5.5. By Region 11. South America Mono Ethylene Glycol Market Outlook, 2015-2030 11.1. Capacity, By Volume 11.1.1. By Country 11.2. Production 11.2.1. By Country 11.3. Operating Efficiency 11.3.1. By Country 12. South America Mono Ethylene Glycol Demand Outlook, 2015-2030, By Volume 12.1. By Type 12.2. By Application 12.3. By Sales Channel (Direct/Institutional Sales, Retail Sales, Other Channel Sales) 12.4. By Company Share (At least top 3 companies’ market share)
12.5. By Country 12.6. Brazil Mono Ethylene Glycol Market Outlook, 2015-2030 12.6.1. Capacity, By Volume 12.6.1.1. By Company 12.6.1.2. By Location 12.6.2. Production 12.6.2.1. By Company 12.6.3. Operating Efficiency 12.6.3.1. By Company 12.6.4. Brazil Mono Ethylene Glycol Demand-Supply Scenario, 2015-2030, By Volume 12.6.4.1. Demand 12.6.4.2. Supply 12.6.4.3. Gap 12.6.5. Brazil Mono Ethylene Glycol Demand Outlook, 2015-2030, By Volume 12.6.5.1. By Type 12.6.5.2. By Application 12.6.5.3. By Sales Channel 12.6.5.4. By Company Share (At least top 3 companies’ market share) 12.6.5.5. By Region 12.7. Argentina Mono Ethylene Glycol Market Outlook, 2015-2030 12.7.1. Capacity, By Volume 12.7.1.1. By Company 12.7.1.2. By Location 12.7.2. Production
12.7.2.1. By Company 12.7.3. Operating Efficiency 12.7.3.1. By Company 12.7.4. Argentina Mono Ethylene Glycol Demand-Supply Scenario, 2015-2030, By Volume 12.7.4.1. Demand 12.7.4.2. Supply 12.7.4.3. Gap 12.7.5. Argentina Mono Ethylene Glycol Demand Outlook, 2015-2030, By Volume 12.7.5.1. By Type 12.7.5.2. By Application 12.7.5.3. By Sales Channel 12.7.5.4. By Company Share (At least top 3 companies’ market share 12.7.5.5. By Region 13. Country-wise Import 14. Country-wise Export 15. News and Deals About Us: ChemAnalyst is a leading provider of chemical commodity prices in more than 12 countries since from last 4 Years. The company has emerged as a preferred pricing supplier amongst Procurement Managers and Strategy Professionals globally who wants to track near real time prices of chemicals on its interactive dashboard. Unlike most of its competitors such as ICIS, IHS & S&P Platts the company doesn’t believe in delivering prices in PDF reports. The company has developed proprietary algorithm based online subscription platform in which users can track years of historical prices of more than 250 chemical commodities. In addition, since it’s all online, the users cannot just compare prices across multiple countries but also with other commodities and play with the data by generating multiple graphs to find out amazing insights. The users get access to grade wise CIF, CFR & Ex Works prices at multiple ports in each country. ChemAnalyst also provides market analysis for more than 1000+ chemical commodities such as Production, Demand, Supply, Plant Operating Rate, Imports, Exports, Suppliers, Customers and much more. The company has created online interactive dashboard in which customers can access all this data instantly with a click of a button. The users will not only be able to analyse historical data for past years but will also get to analyse short term and long-term forecasts for coming years. With the access
to local field teams, the company can provide high quality reliable market analysis data for more than 20 countries. ChemAnalyst is a one stop solution for all the data related needs. We at ChemAnalyst are committed to assist customers worldwide with their data and insights needs using our comprehensive online platform. Contact Us: B-44, Sector -57, Noida, National Capital Region, UP, India 201301 Tel: +91-120-4523900 Email-id: sales@chemanalyst.com