Download
1 / 11
110 likes | 199 Views
Forest City Middle School. Communicating 8 th Grade Math Scores. Middle School Information. 266 Students grades 6-8 Mainly Caucasian with 13 minority students Approximately 70 students with IEP’s Approximately 30% free and reduced lunch. What is Proficiency?.

E N D
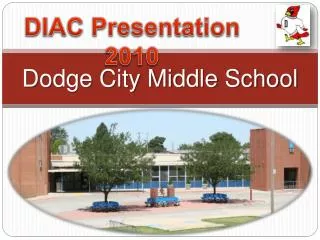
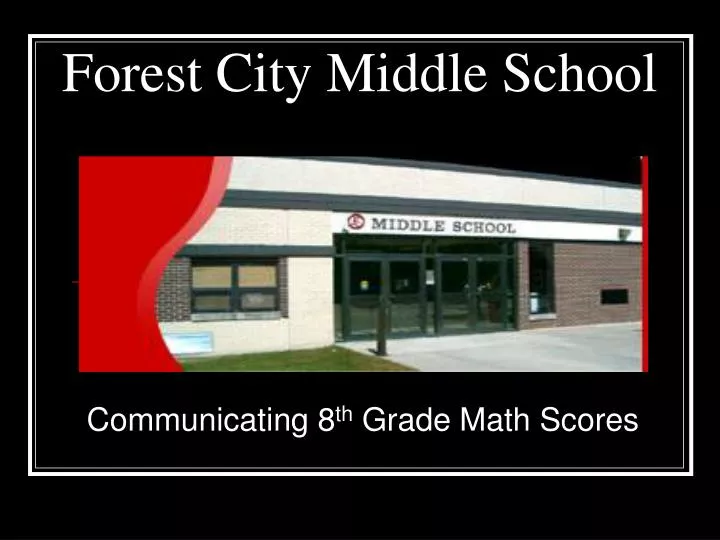
Forest City Middle School Communicating 8th Grade Math Scores
Middle School Information • 266 Students grades 6-8 • Mainly Caucasian with 13 minority students • Approximately 70 students with IEP’s • Approximately 30% free and reduced lunch
What is Proficiency? • Proficiency is the percent of students who scored higher than 41% or on their ITBS tests
8th grade Math ITBS Presentation to the Community • Each community member would receive a copy of the graph • Proficiency would be explained • I would go over graph information as a group on PowerPoint • Presentation would be less than 5 minutes • I would make sure all questions were answered before everyone left
8th Grade Math Scores =========================================== = Represents 41st Percentile
8th grade Math Presentation to the School Board • Each School Board member will receive a copy of the graphs • Proficiency will be explained before presentation is started • Presentation will be short and to the point • Graphs would be shown and explained • All Questions will be answered
Sharing Information with Parents • Through Monthly Newsletter • Information Stand at Parent Teacher Conferences • 6th grade orientation • Through information on Middle School website • Teachers can explain individual scores at parent teacher conferences
Sharing Information with Teachers • A brief summary would be given at teacher meeting • Graphs can be shown and explained • Celebrate positive areas with ITBS Scores • Team leaders will break down scores in their teams • PLC groups can break down specific content areas
8th Grade Math Graph for Teachers **Remind teachers that proficiency level is above 41%**
What teachers are doing to increase ITBS math scores • Each grade takes a math standard test 2 times a year. • Data is collected and analyzed • After being analyzed, math teachers can go over low areas • Special Education teachers give WRAT test (Wide range achievement test) • WRAT Gives grade equivalence & Percentile Rank • Data is collected and analyzed
What teachers will be doing in the future • IGrowth Data will be collected from ITBS and analyzed by teams and PLC’s • Teachers will be looking more at growth of students • Students who are not showing growth will be identified • Practicing research-based instructional strategies through PD to help with all ITBS scores