Download
1 / 12
120 likes | 249 Views
Automated Operational Validation of Meteorological Observations in the Netherlands. Wiel Wauben, KNMI, The Netherlands. Introduction QA/QC chain Measurement system and users Status. Introduction. Automated network for synop and climatological observations.

E N D
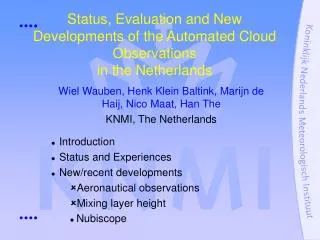
Automated Operational Validation of Meteorological Observations in the Netherlands Wiel Wauben, KNMI, The Netherlands • Introduction • QA/QC chain • Measurement system and users • Status
Introduction • Automated network for synop and climatological observations. • Data near real-time available to internal and external users every 10-minutes. • Observers at airports only for aeronautical reports, but 12 second wind and RVR data provided continuously. • Automated network requires automated validation in real-time.
QC chain Off-line, daily Reporting vs sensor errors, Handling of quality information Real-time? Range, jump persistency, basic inter-relation Inter-relations, temporal, spatial 6 months, technical & station Calibration period 8-24 months or problems, allowed range for deviation Instrument selection Procedures
Basic assumptions • 24*7 considered usefull and reduces manual labour • “No” delay in data flow • QC does not change values • Result of QC check in binary Q-flag • Manual input (link to technical/environmental changes) • Alarm • Validation results should be embedded in QA/QC chain with suitable actions to eliminate causes
Follow up • Overview current QC at various places • Details of methodes and usefullness (number, importance) • Optimal location of QC (OMWA, 10min) • Q indicators traceable throughout data flow (sensor-interface BUFR report) • Follow up (e.g. single jump in temperature) • User should use data AND quality (mask applied for the users • Start with MetNet but keep general
Radar versusprecipitation gauges • Scatter plot • Daily sums • Dependent verification since bias is removed
VIMOLA vert. integr. LAM • Quasi geostrofic • P at msl • 10m wind • currently short term forcast using hourly data • “any” resolution • indicates suspect P values
Outlook • Make business case for basic 10-min near real-time validation • Investigate other possibilities for temporal, spatial and interrelations in RTV • QC at other NMI’s • Start implementation of basic version • Allow for extensions/generalisation