Download
1 / 34
340 likes | 504 Views
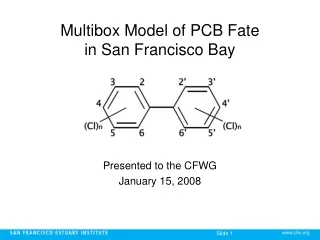
Multibox Model of PCB Fate in San Francisco Bay. Presented to the CFWG May 29, 2007. Version 1.0 draft report (February 2005) Updated sediment model (March 2005) PCB model updated in response Independent testing by Tetra Tech CFWG discussed findings and recommended next steps

E N D
Multibox Model of PCB Fate in San Francisco Bay Presented to the CFWG May 29, 2007
Version 1.0 draft report (February 2005) Updated sediment model (March 2005) PCB model updated in response Independent testing by Tetra Tech CFWG discussed findings and recommended next steps SFEI addresses findings and comments Uncertainty analysis by Tetra Tech (March 2006) CFWG review (November 2006) SFEI performed uncertainty/sensitivity analyses Progress To Date
Preliminary (Uncalibrated) Hindcast Results * Magnitude and spatial distribution of results can be improved.
Considering Tetra Tech’s testing and Workgroup comments, do certain model parameters need revising? Magnitude of WY 2000 tributary loads. Temporal trend of historic PCB loads. Spatial distribution of tributary loads. Targeted Calibration
Historic PCB Loads Breivik et al, 2002
Spatial Distribution of Tributary Loads Model KLI, 2002
Hindcast Results After Targeted Calibration *Still room for improvement. Workgroup recommended spatially explicit Koc.
RMP data insufficient for regional Koc Filter size overestimates dissolved fraction Need objective means of determining Koc Should consider more than just sediment PCBs. Model Bias Estimator Iteratively run model with small perturbations of regional Koc and search for model bias closest to 1 Objective Calibration of Partitioning (Koc)
Estimate model bias for each Bay segment (j) and each matrix (i). For each segment (j) determine mass-weighted bias for all matrices (i). Determine overall (Bay-wide) model bias. Model Bias Estimator
Hindcast Results After Calibration Error Bars: EMAP & RMP = Standard Deviation of Samples Model = Aggregate Uncertainty
Hindcast Results After Calibration Net Erosional Net Depositional
10,000 runs made as part of Tetra Tech testing re-analyzed to determine ‘aggregate uncertainty of model results given uncertainty in input parameters.’ 3 sediment results (SSC, net sedimentation, sediment export) 10 PCB results (wct, sed, mass in water, mass in sed, burial, deposition, degradation, erosion, outflow, volatilization) Uncertainty Analysis
Uncertainty, expressed as std. dev., is function of mean. Use this relation to project uncertainty onto forecast Uncertainty Analysis : Results
Initialized with water and sediment concentrations from EMAP and profiles from end of hindcast Future loads attenuate from current levels with 50yr half-life Relationships of PCBs to SSC @ Mallard Island remain Sedimentation rates/patterns continue Uncertainty determined by hindcast Forecast Setup
Base Forecast : Recovery Due to Natural Attenuation Net Erosional Net Depositional
Sensitivity Sensitivity to PCB Profile Base Forecast
Sensitivity Sensitivity to PCB Profile Base Forecast
Sensitivity Sensitivity to PCB Profile Base Forecast
Sensitivity Sensitivity to PCB Profile Base Forecast
Recovery : Barrel Spill South Bay: 40 kg PCB 9.8e12 g sediment = 4.2 ng/g input
Sediment cores Lower South Bay in particular (depositional) Better info on attenuation/degradation Estimate outflow loads of PCBs (?) Information Gaps