Download
1 / 33
330 likes | 351 Views
This model provides an overview of PCB fate in San Francisco Bay, including validation, uncertainty analysis, sensitivity analysis, and response to extreme scenarios. It identifies information gaps and suggests next steps for improving the model.

E N D
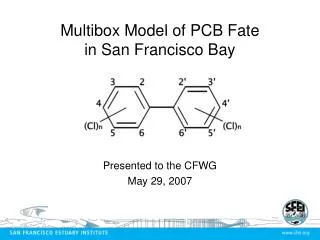
Multibox Model of PCB Fate in San Francisco Bay Presented to the CFWG January 15, 2008
Brief Model Overview Model Confidence Hindcast Model Validation Uncertainty Analysis Model Sensitivity Uncertainty of Important Input Parameters Response to Extreme Scenarios Forecast Results Source and Loss Pathways Information Gaps Next Steps Outline
Central Bay Carquinez Validation : Salinity
Central Bay Mallard Island Lower South Bay Validation : SSC Dashed = Model Solid = Observations
Preliminary (Uncalibrated) Hindcast Results * Magnitude and spatial distribution of results can be improved.
Considering Tetra Tech’s testing and Workgroup comments, do certain model parameters need revising? Magnitude of WY 2000 tributary loads. Temporal trend of historic PCB loads. Spatial distribution of tributary loads Removed this ‘tweak’ per CFWG recommendation Targeted Calibration
Historic PCB Loads Breivik et al, 2002
Hindcast Results After Targeted Calibration *Still room for improvement. Workgroup recommended spatially explicit Koc.
RMP data insufficient for regional Koc Filter size overestimates dissolved fraction Need objective means of determining Koc Should consider more than just sediment PCBs. Model Bias Estimator Iteratively run model with small perturbations of regional Koc and search for model bias closest to 1 Objective Calibration of Partitioning (Koc)
Hindcast Results After Calibration Error Bars: EMAP & RMP = Standard Deviation of Samples Model = Aggregate Uncertainty
Hindcast Results After Calibration Net Erosional Net Depositional
10,000 runs made as part of Tetra Tech testing re-analyzed to determine ‘aggregate uncertainty of model results given uncertainty in input parameters.’ 3 sediment results (SSC, net sedimentation, sediment export) 10 PCB results (wct, sed, mass in water, mass in sed, burial, deposition, degradation, erosion, outflow, volatilization) Uncertainty Analysis
Uncertainty, expressed as std. dev., is function of mean. Use this relation to project uncertainty onto forecast Uncertainty Analysis : Results
*Regional differences due to local watersheds vs. Delta Uncertainty Analysis : Results
Initialized with water and sediment concentrations from RMP 2006 data and profiles from end of hindcast Future loads attenuate from current levels with ~50yr half-life Relationships of PCBs to SSC @ Mallard Island remain Delta outflow includes potential climate change Sedimentation rates/patterns continue Uncertainty determined by hindcast Base Forecast Setup
Model Sensitivity O = Model Output P = Model Input Parameter
Model Sensitivity High Relative Sensitivity Low
Uncertainty of Important Input Parameters : Vertical Profile Profiles that increase subsurface mass change forecast predictions considerably.
Model Sensitivity High Relative Sensitivity Low
Extreme Scenarios : Instantaneous Inputs Double Check of South Bay: 200 kg PCBs mixed into 2.3x10¹³kg sediment = 8.8 ng/g increase
Model Confidence Summary * 2005 survey suggests South Bay depositional. Survey to which model calibrated (1984?) suggested erosional. - D. Schoellhamer, personal communication
Base Forecast : Recovery Due to Natural Attenuation Net Erosional Controlled by Subsurface Mass Net Depositional Controlled by Attenuation & Degradation
PCB Source and Loss Pathways * ‘Active Sediments’ refers to top 5 cm Erosion Inputs ~ Total External Inputs
Sediment cores Hindcast : depositional cores more important Forecast : erosional cores more important Better info on attenuation, degradation, Koc Possible to get better info? Estimate outflow of sediment & PCBs USGS et al. have study planned for 2008 Information Gaps
Is South Bay depositional? Congener specific model Smaller spatial scales – hot spots or sub- embayments (e.g., LSB) 3D hydrodynamics & sediment transport Apply multibox to multiple contaminants (screening tool) Possible next steps or PCB modeling