Download
1 / 20
200 likes | 207 Views
This research aims to construct a defender prior distribution of terrorist preferences by modeling the defender's uncertainty about unobserved attributes. The study uses ordinal estimates to simplify the quantification task and increase acceptance in the intelligence community.

E N D
Quantifying Unobserved Attributes in Expert Elicitation of Terrorist Preferences Vicki Bier, Chen Wang University of Wisconsin-Madison
Research Goals • To construct a reasonable defender prior distribution over possible terrorist preferences: • By explicitly modeling the defender’s uncertainty about unobserved attributes • I.e., attributes that may be important to the terrorist, but are un-quantified or unobserved by the defender • To simplify the task of quantifying threat probabilities for subject-matter experts: • By using ordinal rather than cardinal estimates • To increase the acceptance of quantitative approaches in the intelligence community
Indirect Expert Elicitation • Allows experts to express their knowledge as rank orderings rather than numerical values: • Simplifies the process of bringing expert knowledge to bear • Well suited to elicitation challenges commonly encountered in the intelligence community: • High uncertainty and sparse data • Reluctance on the part of experts to express their knowledge in probabilistic form
Mathematical Approach • Experts provide rank orderings of selected targets or attack strategies: • Reflecting their knowledge of adversary preferences • Adversary preferences are assumed to follow an additive multi-attribute utility function: • With an “error term” representing the effect of any attributes that have not been identified or observed by the defender • Assumed to be independent and identically distributed! • Probabilistic inversion is used to estimate the values of both attribute weights and unobserved attributes: • To yield the best fit to the stated rank orderings • Taking into account expert consensus or disagreement
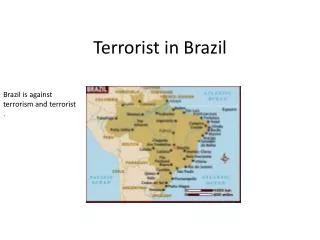
3 Hypothetical Expert Groups • Each group has 10 experts: • Each of whom ranks the top 10 targets • Group 1: • All find X1 (property loss) and X2 (fatalities) important, but not X4 (population density) • Little or no weight on unobserved attributes • Group 2: • All think X4(population density) is important • Opinions reflect an unobserved attribute, corresponding to presence of entertainment industry • Group 3 (expert disagreement): • Five experts from Group 1, and five from Group 2
Modeling Unobserved Attributes • Attempt to fit the attribute weights to the stated rank orderings • Use trial and error to find the weight for the unobserved attribute that yields the lowest infeasibility • Resulting weights: • Group 1: 0.02 • Group 2: 0.09 (largest) • Group 3: 0.08
Results of Probabilistic Inversion • Group 1 yields high weights on X1 and X2: • Low weight on X4 • Group 2 yields the highest weight on X4: • With Group 3 intermediate between Groups 1 and 2 • As expected, Group 2 has the largest infeasibility: • Since the experts in Group 2 take unobserved attributes into account, even the best fit performs worse than the other two groups
Uniform prior Distributions of Attribute Weights Probabilistic inversion Group 1 Group 2 Group 3 X1 and X2increase X4 increases Inconsistent judgments – higher variance
Uniform prior Unobserved Attributes Probabilistic inversion • Can look at the posterior distributions for the unobserved attribute: • To identify candidate unobserved attribute(s) Group 2 • Posterior correlations for unobserved attributes: • Positive correlation between Los Angeles and Las Vegas suggests that some experts consider presence of an entertainment industry important LA, Jersey City, and Las Vegas increase
Predicted Rankings With Unobserved Attributes Red – Increased Blue – decreased Compared to case without unobserved attributes Changes by more than 1 place are colored.
Assessment of Results • Predicted rankings are more consistent with expert judgments when unobserved attributes are included, especially for Group 2: • Las Vegas gets high rankings due to unobserved attribute (presence of entertainment industry) • The model without unobserved attributes does not have the flexibility to adequately reflect expert judgments • Can also be used as a basis for inference about what unobserved attributes • For example, if LA and Las Vegas are rated higher than their known attribute values would suggest: • That might indicate the need to include presence of a large entertainment industry as a terrorist attribute
Assessment of Results • Results may be better than direct weight elicitation • For example, some experts may put high weight on population density: • Without realizing this implies a high ranking for Jersey City • Can deal with conflicting and/or inconsistent expert opinions: • By (possibly multi-modal) distributions of attribute weights with high variance
Pre-Posterior Analysis • How do the models perform with Bayesian updating: • Especially after an unexpected attack? • Problem: • Some targets have zero probability of being attacked in the model • Model would break in the event of an attack on such a target • Cannot condition on a set of measure zero! • Model without unobserved attributes is especially poor in this respect • May need to consider non-uniform (e.g., U-shaped) prior distributions for the unobserved attributes
Bayesian Updating • Consider a target with a positive probability of being attacked: • Assume an (unexpected) attack on Jersey City • Probability that the next attack is also on Jersey City becomes quite high (maybe unrealistically high) • What happens to the attribute weights?
An Attack on Jersey City Prior mean Posterior mean Group 1 Group 2 Group 3 X1 and X2 decrease; X4 increases
Prior mean Posterior of Unobserved Attribute Posterior mean Group 1 Group 2 Group 3 Jersey City has higher values on the unobserved attribute
Predicted Rankings after an Attack on Jersey City Red – increased Blue – decreased Jersey City ranks higher, but not the highest! This seems reasonable Groups 1 and 3 still consider NYC more attractive Changes by more than 2 places are colored.
An Attack on New York City Prior mean Posterior mean No significant changes Group 1 Group 2 Group 3
Future Directions • An alternative approach for fitting expert opinions: • Bayesian density estimation • Sensitivity analysis on the performance of the two approaches: • Computational behavior (convergence properties, run times) • Reasonableness of predicted rankings • Performance with Bayesian updating after expected and unexpected attacks • Obtain stakeholder feedback on applicability of methodology and realism of results