Download
1 / 233

E N D
My Pre-Exam R eading on Acoustic Emission Testing Literature Reading 2016-05: For my ASNT Level III Examination on coming 2016 August. 15thJuly 2016 Fion Zhang/ Charlie Chong
Acoustic Emission Testing Charlie Chong/ Fion Zhang
Acoustic Emission Testing Charlie Chong/ Fion Zhang
Fion Zhang at Norway 18thJuly 2016 Charlie Chong/ Fion Zhang
SME- Subject Matter Expert http://cn.bing.com/videos/search?q=Walter+Lewin&FORM=HDRSC3 https://www.youtube.com/channel/UCiEHVhv0SBMpP75JbzJShqw Charlie Chong/ Fion Zhang
http://www.yumpu.com/zh/browse/user/charliechong http://issuu.com/charlieccchong http://independent.academia.edu/CharlieChong1 Charlie Chong/ Fion Zhang
Charlie Chong/ Fion Zhang http://greekhouseoffonts.com/
The Magical Book of Tank Inspection ICP Charlie Chong/ Fion Zhang
ASNT Certification Guide NDT Level III / PdM Level III AE - Acoustic Emission Testing Length: 4 hours Questions: 135 1 Principles and Theory • Characteristics of acoustic emission testing • Materials and deformation • Sources of acoustic emission • Wave propagation • Attenuation • Kaiser and Felicity effects, and Felicity ratio • Terminology (refer to acoustic emission glossary, ASTM 1316) Charlie Chong/ Fion Zhang
2 Equipment and Materials • Transducing processes • Sensors • Sensor attachments • Sensor utilization • Simulated acoustic emission sources • Cables • Signal conditioning • Signal detection • Signal processing • Source location • Advanced signal processing • Acoustic emission test systems • Accessory materials • Factors affecting test equipment selection Charlie Chong/ Fion Zhang
3 Techniques • Equipment calibration and set up for test • Establishing loading procedures • Precautions against noise • Special test procedures • Data displays 4 Interpretation and Evaluation • Data interpretation • Data evaluation • Reports 5 Procedures 6 Safety and Health 7 Applications • Laboratory studies (material- characterization) • Structural applications Charlie Chong/ Fion Zhang
References & Catalog Numbers NDT Handbook, Second Edition: Volume 5, Acoustic Emission Testing Catalog Number 130 Acoustic Emission: Techniques and Applications Catalog Number 752 Charlie Chong/ Fion Zhang
数字签名者:Fion Zhang DN:cn=Fion Zhang, o=Technical, ou=Academic, email=fion_zhang @qq.com, c=CN 日期:2016.07.21 20:48:25 +08'00' Charlie Chong/ Fion Zhang
闭门练功 Charlie Chong/ Fion Zhang
MONITOR ING ACOUSTIC EMISSION DUR ING TENSILE LOADING OF TH ER MOPLASTIC COMPOSITES MATER IALS Charlie Chong/ Fion Zhang
MONITOR ING ACOUSTIC EMISSION DUR ING TENSILE LOADING OF TH ER MOPLASTIC COMPOSITES MATER IALS A. Laksimi, S. Benmedakhene & L. Bounouas LG2mS URA CNRS UPRES A 6066, Devisions Polymères et Composites Université de Technologie de Compiègne(UTC) Centre de recherche Royallieu BP.20529-60205 Compiègne cedex salim.benmedakhene@utc.fr Charlie Chong/ Fion Zhang
Université de Technologie de Compiègne(UTC). Charlie Chong/ Fion Zhang
SUMMARY: Advance, parameters based acoustic emission AE techniques have been developed to evaluate damage and micro-failures in thermoplastic composites materials. This paper reports on an experimental investigation on mechanical and acoustic emission behaviour of polypropylene glass fibre composites that were tested in tension. An advanced digital signal processing techniques were also employed to identified: (a) fibre and matrix failure, (b) pseudo- delamination, (c) splitting (or cracking along fibres), and (d) friction. These can be discriminated on the basis of different acoustic emission parameters. It is found that the tree parameters of acoustic emission data, (1) the peak amplitude, (2) event duration and (3) event energy are the best indicators for characterisation the damage mechanics. KEYWORDS: Damage mechanics, glass-fibres, polypropylene, acoustic emission (AE), tensile test, acoustics parameters, numerical acoustic system. Charlie Chong/ Fion Zhang
INTRODUCTION The potential for determining damage severity in composite materials by monitoring acoustic emission during proof loading has been assessed. For this purpose polypropylene composites, reinforced by short glass fibre were investigated. The main objective of this work is to propose a new methodology based on acoustic emission and microscopic observations for follow chronology and understand damage mechanics and to assess thismethodology as a measure for damage severity [1]. The potential of acoustic emission EA for providing reliable information and the ease with which it is applied in service depend largely on the AE instrumentation available. Significant improvements and modifications have been made on acoustic emission system including features for numerical acquisition and analyses. It allows also the different types of detection and location of defects, amplitude analysis, energy and duration analysis, counts, counts to peak and frequency analysis, which are coupled with data acquisition systems to display the information in real-time. Charlie Chong/ Fion Zhang
The more numerical modern systems, coupled with qualified mechanical analysis of materials, enable determination not only of the existence of damage, but also of the type and extent of damage, and from this information attempts are being made to infer the location of specimen failure and the probable mechanisms of failure. In this paper the influences of quality of the interface on the elastic behaviour, damage mechanics and the failure of these composites is studied. The correlation between analysis of acoustics parameters and mechanical parameters permit to adapt and confirm, on these materials, the amplitude’s distribution model [2]. On the other hand the results show a good correlation between amplitude, energy and duration of signal, and the statistics approach confirm us this results. From the previous results we conclude that the acoustic emission control coupled to experimental approach of composites structures has been necessary to understand more damage and failure phenomenon. Charlie Chong/ Fion Zhang
Experimental procedure Materials The studied material is a thermoplastic composite with polypropylene matrix PP reinforced byshort glass fibres. The following table gathers the essentialproperties of the two componentsof the composites. Charlie Chong/ Fion Zhang
The samples used in this study are supplied by injection. The material to be injected PP is presented in the form of granulate colorless, translucent, with index of fluidity I = 12g/mn and 166 °C melting point. The fibres used are glass E with 4 mm length and 10 mm diameter approximately. Samples were produced using an injection machine of Fast-Inject type, equipped with a mould doubles impressed, controlled by computer. The realisation is done according to the ISO R527 standard. Parameters of injection (speed, pressure, temperature of injection, temperature of regulation of the mould...) were fixed preliminary by the operator. The following figure presents various materials according to the essential parameters to study, figure 1. Charlie Chong/ Fion Zhang
Fig. 1: Presentation of various studied materials. Charlie Chong/ Fion Zhang
In the continuation of the study, the materials used will be indicated as follows: With: T, indicate treated glass fibres: (oiled) N, untreated glass fibres (not oiled) Charlie Chong/ Fion Zhang
N, indicate untreated glass fibres: (not oiled) Examples: - T20/100 (composite PP reinforced by 20 % of treated glass fibres, injected at 100°C). -N30/35 (composite PP reinforced by 30 % of untreated glass fibres, injected at 35 °C). Tensile tests The tensile tests are carried out on a static machine type INSTRON 1186. In addition to the signals of the acoustic emission, acquisition system collects the load applied to material and the extensometric sizes measured by the strain gages. All these data are stored and treated by a computer. The sample is instrumented by bi-directional gages to measure the longitudinal and transverse strain in the material. Charlie Chong/ Fion Zhang
Acoustic emission The acoustic emission system used in this study consisted of the Physical Acoustics Corporation System Model AEDSP-32/16 & MISTRAS 2001. AEDSP-32/16B card provides high-speed and high-resolution digital waveform collection built in. The standard MISTRAS- 2001 system comes complete with PC and AEDSP-32/16B card, enclosed in an industrial housing. The sampling of features is 2 at 10 MHz per channel, with lower noise (< 18 dB threshold) and the CPU selectable, 15 filters/channel (LP, HP, BP). The 2/4/6/ preamplifier is used with AE system that have their power supplied via the output signal BNC. Provide with 20/40/60 dB gain (switch select), this preamplifier operates with either a signal-ended or differential sensor. In our case the gain was 40dB and the plug-in filter was band pass [20 and 1200 kHz]. Acoustic Emission Signals are detected using a piezoelectric transducer (PAC MICROPHONE 80) and have a large range of frequencies from 200 kHz to 1MHz. A coupling fluid (Dough 428 Rhodorsil Silicone) is used to have a flawless contact between the transducer and the specimen. Charlie Chong/ Fion Zhang
Analysis of experimental results The use of numerical acoustic emission systems makes possible to multiply the number of analysis but request to take precautions during the parameter setting of the system. Indeed the recording of the waveform on which are measured different acoustic parameters depends mainly on the choice of the system timing parameters. The timing parameters are: Peak Definition Time (PDT), Hit Definition Time(HDT) and, Hit lockout Time (HLT). The function of the PDT is to enable determination of the time of the true peak of the AE waveform. The main requirement is avoid false measurements being made on high-velocity, low- mplitude precursor subject to this, PDT should be as short as possible. Charlie Chong/ Fion Zhang
The function of Hit Definition Time (HDT) is to enable the system to determine the end of the hit, close out the measurement processes and store the measured attributes of the signal. In most Physical Acoustic Corporation PAC system the HDT must be at least twice as long as the PDT. The goal is to identify and describe events realistically. The HDT must be long to span over an intervals in which the signal to be measured falls bellow the threshold. Subject to this, the HDT should be set as short as possible, in order to permit, high data throughput rates and reduce the risk that two separate events will be treated as a single hit. The function of Hit lockout Time (HLT) is to inhibit the measurement of reflections and latearriving parts of the AE signal, so that data form wave arrivals can be acquired at a faster rate. The HLT circuitry is a non-triggerable one-shot, triggered by the time out of the HDT. Charlie Chong/ Fion Zhang
The chose of these parameters is based on the waveform analysis and the frequency spectrum obtained from used materials, following figures. Fig. 2: Acoustic emission Waveform. Charlie Chong/ Fion Zhang
Fig. 3: Acoustic emission frequency spectrum. Charlie Chong/ Fion Zhang
In the case of used material and present experimental conditions the following values of the timing parameters were selected for doing the tensile test: PDT = 40 μ μs, HDT = 80 μ μs and HLT = 200 μ μs From the acoustic waveform different acoustics parameters are measured and analysed to identify damages mechanics in composite materials. Many works concerning different composites with different fibres and resins [3,4,5,6] have confirmed that the acoustic emission amplitude ranges correspond to different damage mechanisms, figure 5. Charlie Chong/ Fion Zhang
Fig. 4: Typical Amplitude Distribution and Areas definition Charlie Chong/ Fion Zhang
The damage growth detection and monitoring have been performed using the amplitude analysis of Acoustic Emission signals generated during the advent of damage and failure mechanisms. In addition of this parameter use of the energy and duration distribution will allows a better comprehension and thus the best followed mechanisms. Figure 5, shows the 3D distribution of AE amplitude. In order to determine the correspondence between the three parameters amplitude, energy and duration we carried out a graphic filtering. This graphic filter makes it possible to visualise on graphic the values of energies and the duration depending on range of chosen amplitude. Indeed in the first part are selected energy and the duration related to the amplitudes between 40 and 50 dB mainly due to the resin crack. Figure 6, present the top-view of amplitude distribution of acoustic emission filtered between 40 ad 50 dB. Charlie Chong/ Fion Zhang
Fig. 5: Three-dimensional distribution of acoustic emission EA amplitude. Charlie Chong/ Fion Zhang
Fig. 6: Top-view of Three-dimensional distribution of amplitude between 40 and 50 dB. Charlie Chong/ Fion Zhang
This filtering give the following distributions of absolute energy and duration (figure7). Fig. 7: Distribution of duration and absolute energy linked to 40 and 50 dB amplitude. Charlie Chong/ Fion Zhang
Between 40 and 50 dB the events have a weak energies comprised between 1 and 100 aJ (atto joule) (How many joules in 1 attojoules? The answer is 1.0E-18.) and duration comprised between 10 and 100 μs. In this case the hit are characterised by a low amplitude and a fast attenuation of the signal. Same analyses are done for different range of acoustic amplitude (50-60 dB, 60-80 dB and 80-100 dB). This approach highlights the interactions that there were between the sorting acoustics parameters (amplitude, energy and duration). In the last part are selected energy and the duration related to the amplitudes between 80 and 100 dB mainly due to the fiber failure (figure 8 and 9). Charlie Chong/ Fion Zhang
Fig. 8: Top-view of Three-dimensional distribution of amplitude between 80 at 100 dB. Charlie Chong/ Fion Zhang
Fig. 9: Distribution of duration and absolute energy linked to 80 at 100 dB amplitude. Charlie Chong/ Fion Zhang
Preceding figures shows clear manner that strong amplitude event are characterised by significant duration and of strong energy. These events are mainly related to the fibre failure and with the macro final failure of the sample or of the composite structure. In the figure 10 are presented a multiparametric analysis which permit to visualise and to follow in real-time the three acoustic parameters and the damage of composite materials. Charlie Chong/ Fion Zhang
Fig. 10:Correlation between energy-amplitude and duration and amplitude of AE. Charlie Chong/ Fion Zhang
Tensile test analysis In this study the goal of the tensile tests is to determine the influence of the structural parameters on the elastic behaviour, damage and failure of materials. The following figures illustrate the behaviour difference between the two materials where the only parameter which exchange is the quality of the interface. Charlie Chong/ Fion Zhang
Fig. 11: Stress-strain and cumulative of acoustic evolution. T20/100 and N20/100 material. Charlie Chong/ Fion Zhang
Indeed, a significant difference in mechanical behaviour is observed between the curve Stress-Strain in figure 11 correspondent to the T20/100 material where the quality of the interface is improved by the addition of an oiling and the curve correspondent to the N20/100 sample, with poor quality of matrix/fibre interface. In the case of T20/100 material, three significant phases on the curve are observed : A first linear elastic phase. A second non-linear phase related to beginning of damage mechanics. In the start of this phase, the appearance of the first events of acoustic emission generated are observed. The third phase is characterized by a break of slope of the stress- train curve. This change is accompanied by a strong acoustic emission. An exponential evolution is observed on the latter of cumulate curve indicating a strong damage leading to the final failure of material. Charlie Chong/ Fion Zhang
In the case of the N20/100 material, the behaviour is characterised by three phases different from the preceding case. A first linear elastic phase which permit to measure the elastic properties of material. A second non-linear phase, where no acoustic emission is detected. This phase relate a plastic deformation without damages. At the end of this part, appears the third phase where the stress-strain curve reach to a creep plate where the deformation grow under constant stress. This phase is characterised by a strong acoustic emission activity. This creep plate indicate the absence of load transfer between the matrix and glass fibre beyond the elastic field. The table below present the elastic constant and failures characteristics with a comparison between the two types of interfaces. Charlie Chong/ Fion Zhang
Taleau 2. Results of tensile test on composite materials with bad and good interface. Charlie Chong/ Fion Zhang
E = Elastic Modulus, sr = Failure stress, er = Failure strain. The oiling of fibres permit to double the failure stress of composite material. On the other hand the elastic modulus is not affected by this parameter. In both cases (treated fibres and untreated fibres), the acoustic emission (E.A.) characterise the appearance and the evolution of the damage after a quiet zone corresponding to the elastic phase [7,8]. Charlie Chong/ Fion Zhang
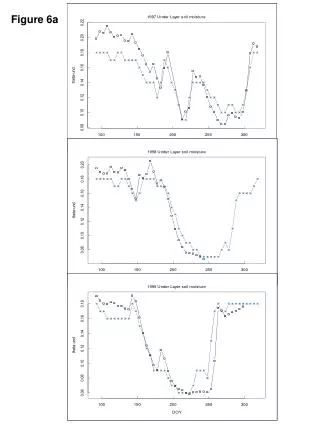
Analysis of the damage Within the framework of the damage mechanisms analysis, a continuous correlation is established between the acoustic emission and the microscope observations. The amplitude distribution has the advantage to affect the events according to their amplitudes and to classify it according to theirdamage ranges. It also makes possible to follow damage chronological way during the loading. Figures 12 present the distributions of amplitude obtained for sample loaded in tensile test, with oiled and not oiled fibres/matrix interface. Charlie Chong/ Fion Zhang