Download
1 / 28
280 likes | 360 Views
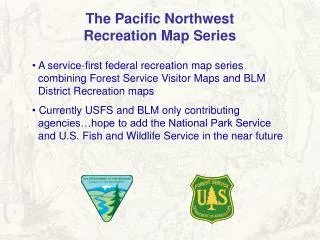
PUBLIC USE DEMOGRAPHIC MAP SERIES. Data, analysis and cartography by P. Ethington, History Dept., USC. Made Possible by the John Randolph Haynes and Dora Haynes Foundation. Distribution is unrestricted and encouraged. See also www-rcf.usc.edu/~philipje LAST REVISED 11 NOVEMBER 2006.

E N D
PUBLIC USE DEMOGRAPHIC MAP SERIES Data, analysis and cartography by P. Ethington, History Dept., USC. Made Possible by the John Randolph Haynes and Dora Haynes Foundation. Distribution is unrestricted and encouraged. See also www-rcf.usc.edu/~philipje LAST REVISED 11 NOVEMBER 2006
Race-Ethnic Majority Series Los Angeles County 1940-2000 Koreatown and Watts Indicated
Koreatown Watts Data, analysis and cartography by Phil Ethington, USC. Made Possible by the John Randolph Haynes and Dora Haynes Foundation. Distribution is unrestricted and encouraged. See also www-rcf.usc.edu/~philipje
Koreatown Watts Data, analysis and cartography by Phil Ethington, USC. Made Possible by the John Randolph Haynes and Dora Haynes Foundation. Distribution is unrestricted and encouraged. See also www-rcf.usc.edu/~philipje
Koreatown Watts Data, analysis and cartography by Phil Ethington, USC. Made Possible by the John Randolph Haynes and Dora Haynes Foundation. Distribution is unrestricted and encouraged. See also www-rcf.usc.edu/~philipje
Koreatown Watts Data, analysis and cartography by Phil Ethington, USC. Made Possible by the John Randolph Haynes and Dora Haynes Foundation. Distribution is unrestricted and encouraged. See also www-rcf.usc.edu/~philipje
Koreatown Watts Data, analysis and cartography by Phil Ethington, USC. Made Possible by the John Randolph Haynes and Dora Haynes Foundation. Distribution is unrestricted and encouraged. See also www-rcf.usc.edu/~philipje
Koreatown Watts Data, analysis and cartography by Phil Ethington, USC. Made Possible by the John Randolph Haynes and Dora Haynes Foundation. Distribution is unrestricted and encouraged. See also www-rcf.usc.edu/~philipje
Koreatown Watts Data, analysis and cartography by Phil Ethington, USC. Made Possible by the John Randolph Haynes and Dora Haynes Foundation. Distribution is unrestricted and encouraged. See also www-rcf.usc.edu/~philipje
Median House Value Series Los Angeles County 1990-2000 Showing values above (green) and below (red) the county median value (yellow), by standard deviations Koreatown and Watts Indicated Data, analysis and cartography by Phil Ethington, USC. Made Possible by the John Randolph Haynes and Dora Haynes Foundation. Distribution is unrestricted and encouraged. See also www-rcf.usc.edu/~philipje
Koreatown Watts Data, analysis and cartography by Phil Ethington, USC. Made Possible by the John Randolph Haynes and Dora Haynes Foundation. Distribution is unrestricted and encouraged. See also www-rcf.usc.edu/~philipje
Koreatown Watts Data, analysis and cartography by Phil Ethington, USC. Made Possible by the John Randolph Haynes and Dora Haynes Foundation. Distribution is unrestricted and encouraged. See also www-rcf.usc.edu/~philipje
Median House Value Series, Detail 1960, 1980, 2000 Showing values above (pink) and below (blue) the county median value (yellow), by standard deviations Data, analysis and cartography by Phil Ethington, USC. Made Possible by the John Randolph Haynes and Dora Haynes Foundation. Distribution is unrestricted and encouraged. See also www-rcf.usc.edu/~philipje
1960 MEDIAN VALUES Koreatown Watts Data, analysis and cartography by Phil Ethington, USC. Made Possible by the John Randolph Haynes and Dora Haynes Foundation. Distribution is unrestricted and encouraged. See also www-rcf.usc.edu/~philipje
1980 MEDIAN VALUES Koreatown Watts Data, analysis and cartography by Phil Ethington, USC. Made Possible by the John Randolph Haynes and Dora Haynes Foundation. Distribution is unrestricted and encouraged. See also www-rcf.usc.edu/~philipje
2000 MEDIAN VALUES Koreatown Watts Data, analysis and cartography by Phil Ethington, USC. Made Possible by the John Randolph Haynes and Dora Haynes Foundation. Distribution is unrestricted and encouraged. See also www-rcf.usc.edu/~philipje
Race-Ethnic Majority Series Showing Koreatown and Environs 1940-2000 Data, analysis and cartography by Phil Ethington, USC. Made Possible by the John Randolph Haynes and Dora Haynes Foundation. Distribution is unrestricted and encouraged. See also www-rcf.usc.edu/~philipje
1940 Majorities Data, analysis and cartography by Phil Ethington, USC. Made Possible by the John Randolph Haynes and Dora Haynes Foundation. Distribution is unrestricted and encouraged. See also www-rcf.usc.edu/~philipje
1950 Majorities Data, analysis and cartography by Phil Ethington, USC. Made Possible by the John Randolph Haynes and Dora Haynes Foundation. Distribution is unrestricted and encouraged. See also www-rcf.usc.edu/~philipje
1960 Majorities Data, analysis and cartography by Phil Ethington, USC. Made Possible by the John Randolph Haynes and Dora Haynes Foundation. Distribution is unrestricted and encouraged. See also www-rcf.usc.edu/~philipje
1970 Majorities Data, analysis and cartography by Phil Ethington, USC. Made Possible by the John Randolph Haynes and Dora Haynes Foundation. Distribution is unrestricted and encouraged. See also www-rcf.usc.edu/~philipje
1980 Majorities Data, analysis and cartography by Phil Ethington, USC. Made Possible by the John Randolph Haynes and Dora Haynes Foundation. Distribution is unrestricted and encouraged. See also www-rcf.usc.edu/~philipje
1990 Majorities Data, analysis and cartography by Phil Ethington, USC. Made Possible by the John Randolph Haynes and Dora Haynes Foundation. Distribution is unrestricted and encouraged. See also www-rcf.usc.edu/~philipje
2000 Majorities Data, analysis and cartography by Phil Ethington, USC. Made Possible by the John Randolph Haynes and Dora Haynes Foundation. Distribution is unrestricted and encouraged. See also www-rcf.usc.edu/~philipje
Median House Value Series, Detail Showing Koreatown and Environs 1960, 1980, 2000 Showing values above (pink) and below (blue) the county median value (yellow), by standard deviations Data, analysis and cartography by Phil Ethington, USC. Made Possible by the John Randolph Haynes and Dora Haynes Foundation. Distribution is unrestricted and encouraged. See also www-rcf.usc.edu/~philipje
Data, analysis and cartography by Phil Ethington, USC. Made Possible by the John Randolph Haynes and Dora Haynes Foundation. Distribution is unrestricted and encouraged. See also www-rcf.usc.edu/~philipje
Data, analysis and cartography by Phil Ethington, USC. Made Possible by the John Randolph Haynes and Dora Haynes Foundation. Distribution is unrestricted and encouraged. See also www-rcf.usc.edu/~philipje
Data, analysis and cartography by Phil Ethington, USC. Made Possible by the John Randolph Haynes and Dora Haynes Foundation. Distribution is unrestricted and encouraged. See also www-rcf.usc.edu/~philipje