Download
1 / 36
360 likes | 502 Views
Integrated Public Use Microdata Series. IPUMS www.ipums.org. Matt Sobek Minnesota Population Center sobek@pop.umn.edu. IPUMS Overview. 1. What is the IPUMS. 1. What is the IPUMS. 2. Harmonization. 3. Additional Data Enhancements. 4. Access. 5. Strengths and Limitations.

E N D
Integrated Public Use Microdata Series IPUMS www.ipums.org Matt SobekMinnesota Population Centersobek@pop.umn.edu
IPUMS Overview 1. What is the IPUMS 1. What is the IPUMS 2. Harmonization 3. Additional Data Enhancements 4. Access 5. Strengths and Limitations 6. Research examples
Brief History IPUMS-USA 1991 -- Steve Ruggles All existing samples of US census Data extraction system 1998 IPUMS-International 2001 2004 IPUMS-Latin America 2005 IPUMS-Europe 2005 NSF Expansion World’s largest collection census data 30 samples per year for the next 3 years Bob McCaa
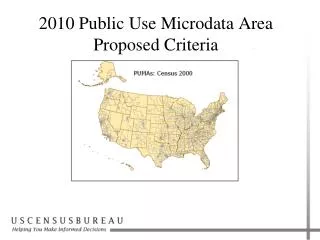
IPUMS Global Coverage Dark green = disseminating Medium green = data held by IPUMS Light green = negotiating Yellow = not negotiating
What Are Microdata? Individual-level data • every record represents a separate person • all of their individual characteristics are recorded • users must manipulate the data themselves Different from aggregate/summary/tabular data • a count of persons by municipality • an employment status table by sex from a published census volume
Age Birthplace Mother’s birthplace Sex Relationship Race Occupation IPUMS Data Structure Household record (shaded) followed by a person record for each member of the household For each type of record, columns correspond to specific variables
The Advantages of Microdata Combination of all of a person’s characteristics Characteristics of everyone with whom a person lived Freedom to make any table you need Freedom to make models examining multivariate relationships Basically, you are only limited by the questions asked in the particular census
IPUMS Overview 1. What is the IPUMS 2. Harmonization 3. Additional Data Enhancements 4. Access 5. Strengths and Limitations 6. Research examples
Translation Table – Marital Status (IPUMS-International) China 1982 Colombia 1973 Kenya 1989 Mexico 1970 U.S.A. 1990
Translation Table – Marital Status General Codes
IPUMS Overview 1. What is the IPUMS 2. Harmonization 3. Additional Data Enhancements 4. Access 5. Strengths and Limitations 6. Research examples
IPUMS “Pointer” Variables (Simple household) Spouse’s 2 1 0 0 0 0 Mother’s Father’s 0 0 0 0 0 0 2 1 2 1 2 1
1 1 1 1 IPUMS “Pointer” Variables (Complex household) Spouse’s Mother’s Father’s 0 0 0 0 0 0 0 0 0 6 0 5 0 0 0 5 6 0 5 6 0 0 0 0 9 0 0 9 0
IPUMS Overview 1. What is the IPUMS 2. Harmonization 3. Additional Data Enhancements 4. Access 5. Strengths and Limitations 6. Dissemination
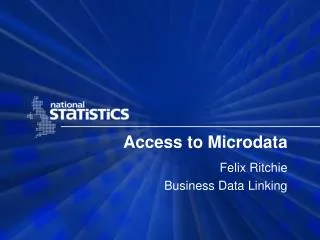
IPUMS Access • Restricted access • Scholarly and educational purposes • Conditions of use: key is not to redistribute • Serious vetting
IPUMS Overview 1. What is the IPUMS 2. Harmonization 3. Additional Data Enhancements 4. Access 5. Strengths and Limitations 6. Research examples
Large More cases than any comparable datasets Enable study of relatively small populations • National in scope Results not subject to local peculiarities Provide context for local studies • Temporal depth Provide historical perspective • Microdata Can make your own tabulations Apply multivariate techniques 4 Key Strengths of the Census Microdata Samples
Limitations of the Microdata Samples Confidentiality • Samples Too small to answer some questions • Geography 20,000 population or larger • Sensitive variables, swapping, etc
Not annual Any historical analysis will have gaps • Cross-sectional data Not longitudinal Other Issues and Limitations • Very large extracts • Need knowledge of a statistical package • User burden Information overload; culturally specific knowledge
IPUMS Overview 1. What is the IPUMS 2. Harmonization 3. Additional Data Enhancements 4. Users and Access 5. Strengths and Limitations 6. Research examples
IPUMS-International Research Topics • Child labor outside the household in Mexico and Colombia • Effect of NAFTA on educational attainment and school • enrollment by region within Mexico • Concentration of mortality within families in Kenya • Life course patterns of co-residence among Mexicans in • Mexico, Mexicans in the U.S., and Mexican Americans • Brain drain from developing countries • How language diversity is affected by migration and economic • factors
Brazil Colombia Venezuela Chile Ecuador Costa Rica Mexico Married Female Labor Force Participation in Latin America (age 18 to 65) 50 45 40 35 30 Percent in Labor Force 25 20 15 10 5 0 1960 1965 1970 1975 1980 1985 1990 1995 2000 2005
70 60 50 40 Percent in Labor Force 30 20 10 0 1920 1930 1940 1950 1960 1970 1980 1990 2000 2010 Married Female Labor Force Participation: Latin America and U.S. (age 18 to 65) United States Latin America
Brazil Colombia Venezuela Ecuador Chile Costa Rica Mexico Married Female Labor Force Participation: Latin America and U.S. (age 18 to 65) 70 United States 60 50 40 Compare Latin America to U.S. 40 years ago Percent in Labor Force 30 20 10 0 1920 1930 1940 1950 1960 1970 1980 1990 2000 2010
Married Female Labor Force Participation: Mexican-born Women, 1970-2000 70 60 Mexican-born Women in United States 50 40 Percent in Labor Force 30 Women in Mexico 20 10 0 1970 1975 1980 1985 1990 1995 2000
End sobek@pop.umn.edu