Download
1 / 48
480 likes | 504 Views
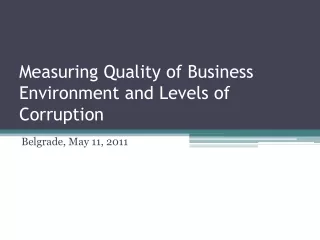
Measuring Quality of Business Environment and Levels of Corruption. Belgrade, May 11, 2011. Agenda. Business Environment and Enterprise Performance Survey Summary of BEEPS results: How has the business environment changed from the perspective of firms? Highlighted findings:

E N D
Measuring Quality of Business Environment and Levels of Corruption Belgrade, May 11, 2011
Agenda Business Environment and Enterprise Performance Survey • Summary of BEEPS results: How has the business environment changed from the perspective of firms? • Highlighted findings: • Regulatory Burden: Serbia follows regional trends • The Judiciary: Capacity must meet need • Trends in Corruption: perceptions mask progress Measuring Corruption • How • What • Where
The Business Environment in Serbia Pre-Crisis: Progress and Promise • The results of the 2008 BEEPS show it was easier to do business in 2008 compared to 2005: • Perceptions of tax rates, tax administration, labor regulations, customs and trade regulations, access to financing and courts improved • Serbian firms report more positive perceptions than regional average of the levels of crime, telecommunications, access to land, tax rates and tax administration, and others. • Certain areas remain ripe for additional efforts • Although perceptions improved, Serbia falls below the average in firms’ perceptions of access to finance, courts, labor and customs regulations, showing that small steps have made an impact – additional efforts may accomplish more.
New Challenges Emerge between 2005-2008: • Corruption became the #1 obstacle to doing business in Serbia perceived by firms. • It was 3d obstacle in 2005. • Skills and education of labor became a top 5 obstacle in Serbia • Ranked as the 5th obstacle to doing business based on firm perceptions • Firms perceive electricity to be a greater obstacle • In Serbia, electricity rose from 14th to 6th in the ranks of perceived obstacles. • Electricity became the 3rd obstacle overall in ECA
Regulatory Burden lightened in ECA, but remains high for Serbian firms • Serbian firms spend twice as many days than the ECA average to get permits • They also spend more time than average on inspections and getting compulsory certificates. • But business licensing and permits are not perceived to be a severe obstacle • Ranked 12th of 14 obstacles • Therefore other issues are more pressing comparatively
Administrative Delays May Hinder Performance Delays (Number of Days) • Procedures to secure licenses and permits result in higher delays for Serbian firms. • Reforms in 2009 added 75 days to the time needed for a construction permit (according to Doing Business) • New reforms in 2010 on starting a business may reduce the burden on new firms in Serbia.
Business-Government Relations: Informal Payments for Services Percentage of Firms Making Informal Payments • Firms seeking service connections and construction permits are more likely to pay a bribe. • Compared to the delays reported by firms, it is unlikely they are paying for expediency.
Strides in Tax Administration Percentage of Firms Visited by Tax Officials in the Last Year • Tax administration fell from the 5th highest obstacle to the 9th in 2008. • Fewer firms were inspected by tax authorities in 2008: falling from 80% to 49%, however the number of inspections remained at 4. • Bribery in dealing with taxes is the same as the ECA average, but higher than the SEE and EU-10 averages
The Judiciary: Capacity Must Meet Need • Per the BEEPS, Serbian firms use courts more than any other country in ECA: 52% over the ECA average of 26%. • Per a 2010 IPSOS study, 71% of firms have some experience with administrative court services in the last 3 years. • Courts ranked as the 4th highest obstacle to doing business in Serbia in 2008 • 35% of firms stated courts were a moderate to very severe obstacle • similar findings in the IPSOS study. Perception of court quality worsens when use increases
Time is of the Essence • In Serbia, only 8% of firms using courts agreed courts were “quick” in 2008. • Reforms to increase speed are being undertaken acrossECA • There are hintsof improvements: IPSOS study shows this number rising to 21% in a 2010.
Serbian Firms are moreConfident in Enforcement of Decisions • Across ECA perceptions of enforcement are more favorable than perceptions of speed or integrity. • In Serbia, there is a smaller gap between court users and all firms, signaling a general agreement regarding courts’ ability to enforce decisions. • Serbia exceeds the SEE average in terms of perceptions of court enforcement by court users, falling just short of the EU-10 average.
Judicial Integrity: Fairness vs. Corruption • Only 21% of firms using courts see them as being fair, impartial, and uncorrupted. • The issuemay be one of fairness inverdicts and awards, not indicativeof corruption.
Trends in Corruption: Perceptions Mask Progress Bribe Frequency • Administrative corruption continued to decline across ECA. • Corruption was the #1 obstacle in Serbia in 2008 perceived by firms. • Reports of corruption have dropped dramatically since 2005: • Reported bribe frequency and the bribe tax both dropped 50% over 3 years Bribe Tax Top right: Percentage of firms stating informal payments are frequent Bottom right: Percentage of firms reporting making informal payments
Corruption: Perceptions Mask Progress • Reports of bribery in sectors also declined in Serbia by 50% or more in taxes, customs, and courts • The results are striking, but Serbia still exceeds the SEE and EU-10 averages. • Additional efforts and enforcement of anti-corruption legislation may reduce occurrences further Bribe Frequency for Taxes Bribe Frequency for Customs Bribe Frequency for Courts
Summary • Serbian firms reported relatively high waiting time for permits and licensing, and have a higher than average incidence of bribery for services. • Perceptions of tax administration have improved, likely due to the drop in the percentage of firms inspected and lower than average time to file and pay taxes • Per the BEEPS, Serbian firms use courts more than any other country in ECA: 52% over the ECA average of 26%. • Serbian firms follow certain regional trends: • Although corruption is the top obstacle measured by firm perceptions, reports of bribery decreased 50% or more overall and across sectors. but Serbia still exceeds both the SEE and EU-10 averages.
BEEPS Data Portal: Information at your Fingertips The BEEPS Data Portal is a new interactive tool that allows users to analyze and display data, design custom charts and create dynamic reports using standard templates. The Portal allows users to manipulate data from the 2005 and 2008 BEEPS surveys and other supplementary sources. Users can view results by country and year and calculate custom indicators in seconds. All reports, charts and tables can be downloaded into multiple formats for ease of use. The BEEPS Data Portal is publicly available. For more information on the BEEPS Data Portal and the BEEPS Project, enter the link below in your browser. Access the BEEPS Data Portal at: http://beeps.prognoz.com
Measuring corruption How, what and where
Corruption: Measured in three broad ways 1. By gathering the informed views of relevant stakeholders. These include surveys of firms, public officials, and individuals, as well as views of outside observers in NGOs, multilateral donors, and the private sector. These data sources can be used individually, or in aggregate measures which combine information from many such sources. These are the only available data sources that currently permit large-scale cross-country comparisons and monitoring of corruption over time. 2. By tracking countries' institutional features. This provides information on opportunities and/or incentives for corruption, such as procurement practices, budget transparency, etc. These do not measure actual corruption, but can provide useful indications of the possibility of corruption. There efforts as yet have relatively limited country coverage and as yet have almost no time dimension. 3. By careful audits of specific projects or processes. These can be purely financial audits, or more detailed comparisons of spending with the physical output of projects. Such audits can provide information about malfeasance in specific circumstances, but not about country-wide corruption more generally. While they are very valuable to learn about the specifically audited project/processes, they are very country-specific and not well suited for monitoring over time.
Empirical Framework: from aggregate to disaggregate indicators of corruption • High Aggregation, e.g. WGI, TI • Medium Aggregation, e.g. WEF, BEEPS, Doing Business • Micro Level, in-country, in-depth diagnostic, e.g. scorecards (Bangalore), topical surveys of specific populations (TCC, L&RET and various SME surveys), WBI GAC diagnostics, randomized experimental projects, “mystery shopping” tools, etc. • Complementarities and Hybrids
Identifying Trends: Longitudinal measures • One benefit of using aggregated indicators – they are usually comparable across time. • The longitudinal indicators can be compared to cross-sectional indicators to help explain trends. Top Right Graph: Control of Corruption in Serbia 1998-2009 Percentile Ranks (WGI) Bottom Right Graph: Corruption Perception Index for Serbia 2006-2010 (TI)
Gathering data: subjective and objective measures Survey-based questions on corruption become increasingly specific, focused, and quantifiable. The Global Competitiveness Survey (World Economic Forum) asks firms experience with kick-backs in government procurement and values and volumes of unofficial payments to public officials. Similar specific questions are also presented by other firm surveys like World Bank’s Business Environment and Enterprise Performance Survey (BEEPS). Household surveys like the Gallup’s Voice of the People and Global Barometer Surveys which is used by the TI Latino-Barometro asks respondents to report actual percentages of corrupt officials or actual number of times they witnessed acts of corruption. Composite instruments for various targeted populations of respondents were developed by the World Bank as the Governance and Anti-Corruption Diagnostic tool. Corruption usually leaves no paper trail, responses about corruption based on individuals' actual experiences are sometimes the best available, and the only, information we have. Perceptions also matter directly: if for example citizens believe the courts and police to be corrupt, they will not want to use their services regardless of what the objective reality is.
Example 1: Subjective and Objective The above chart shows the percentage of court using Serbian firms and other firms stating that unofficial payments are frequently, usually, or always expected to get things done, and when dealing with courts specifically.
Detailed mapping of processes and bottlenecks • These are not direct measures of corruption, these instruments provide useful indications of the possibility of corruption. • The best known instrument of this nature, although not very useful for monitoring of explicit corruption risks, is Doing Business • For example, Doing Business maps all the procedures, time to complete and associated costs for dealing with construction permits, which in 2010 consisted of 20 procedures, taking 279 days, and costing 1821.4% of income per capita.
Comparing Maps to Other Measures Brings Focus to Details • Comparing indicators from multiple sources provides a more detailed picture. • Using the example of the construction permit: • Per DB process mapping, this can take up to 279 days (for a large project just outside of the capital city). • The BEEPS results show the average number of days to obtain a construction permit is 133.49 days. • The BEEPS also shows that 17% of those who applied for a construction permit reported solicitation for informal payments • This may signal that informal payments may speed up the process, or that in other areas outside the bigger cities the process is less time consuming.
Example 2: Obtaining a Land Plot for Business Use Document Issuing Department Signing Department Application to the Department of Economy and Planning Committee for land resources and land use planning Construction Passport Department of Economy and Planning Preliminary technical specifications for preliminary approval of project design and connection to engineering infrastructure Department of Economy and Planning Preliminary lease contact Head of Municipal Administration Head Directorate for Architecture and City Planning Sketch of the location of the structure Project cost estimate Head Directorate for Architecture and City Planning Draft of the Approval of the Local Administration Head for the construction/reconstruction permit Sanitary-Epidemiological Inspection Head of Municipal Administration Lease agreement for the land plot for the period of construction/reconstruction State Fire Inspection Registration of the land lease contract in the Book of Land Registry Committee for land resources and land use planning Draft of the Approval of the Local Administration Head for the Leasing contract on the Lease of land plot State Judicial Committee Obtaining of the proof of lease and the lease contract (a.k.a. registration of the lease in the Book of Land Registry)
Building a Measurement Tool(food for thought or issues for discussion) • What do you want to measure? • Where do you want to measure it? • How do you want to measure it? • Is it a one-off or regular exercise? • Who is going to do the data collection? • Who is going to do data analysis? • Who is the targeted audience? • Who are the stakeholders (on both sides)?
Building Blocks 1: What? • Perceptions (e.g. “In Your opinion …”) • Generic levels (e.g. “If a firm like yours …”, “In the last 12 months did you or anybody you know…” • Personal experiences (e.g. “Have you …”) • Sizes/amounts (e.g. “If you request X what is the amount of an unofficial payment …”) • Frequency (e.g. “How often … every time, once a year …” • Attitudes (e.g. “Is corruption an obstacle …”, “Do you think it is normal to give Y a gift for …”, “At what amount a gift becomes a bribe …”) • Quality of legal framework (e.g. various de jure and institutional quality indicators and tools)
Building Block 2: Where? • Country/regional level (e.g. BEEPS, WBI Corruption Diagnostics, CSC, LiTS, DB (including sub-national), WEF EOP, WGI, PEFA, TI CPI, etc.) • Sector or agency level (e.g. L&RES, TCCS, Sector Score Cards, etc.) • Process level (e.g. PETS – financing of education or health services)
Building Block 3: How? • Administrative statistics (e.g. number of complaints, number of court cases/convictions, investigations) • Indirect measures (e.g. through country institutional features such as delays, cost of permits, number of steps in procedures, asset declarations vs. life-style checks, etc.) • “Mystery shopping”, randomized experiments • Studies of legal and regulatory framework, • Expert opinion polls, and last, but not least • Surveys
Frequency • One-off – not recommended, though happens very often due to financial and political constraints • Repeated • Base-line before or at the beginning of specific reform effort and then after 12-24 months to measure progress • Repeated (BEEPS, etc.) to measure changes in the environment over time • Mixture – repeated modular exercise that includes one-off blocks covering “flavor of the day” topics • Needless to say, that frequency depends on availability of resources and political will
Four “WHOs” • … is going to do data collection • government agency vs. reputable independent institution • … is doing the data analysis • government vs. data collection institution vs. a reputable think tank • … is the targeted audience • public/government at large/law enforcement agencies/media/policy makers or a mix/all of the above • … are the stakeholders • supporters • opposition.
Selected sources of broader governance data for cross-country comparisons • Cross-Country Surveys of Firms: Global Competitiveness Survey, World Business Environment Survey, World Competitiveness Yearbook, BEEPS • Cross-Country Surveys of Individuals: Gallup International Voice of the People, Latinobarometro, Afrobarometer, Life in Transition Survey • Expert Assessments from Commercial Risk Rating Agencies: DRI, PRS, EIU, World Markets Online, Merchant International Group, IJET Travel Consultancy, PERC • Expert Assessments from NGOs, Think Tanks: Reporters Without Borders, Heritage Foundation, Freedom House, Amnesty International, Bertelsmann Foundation, Columbia University, International Research and Exchanges Board, Global Integrity Project • Expert Assessments from Governments, Multilaterals: World Bank CPIA, EBRD, AFDB, ADB, State Dept. Human Rights Report, Trafficking in Persons Report
Selected Links The Global Competitiveness Survey (World Economic Forum) (http://www.weforum.org/en/initiatives/gcp/Global%20Competitiveness%20Report/index.htm) World Bank’s Business Environment and Enterprise Performance Survey (BEEPS) (http://go.worldbank.org/RQQXYJ6210). Gallup’s Voice of the People and Global Barometer Surveys (http://www.gallup-international.com/) Transparency International (http://www.transparency.org/) Latino-Barometro (http://www.latinobarometro.org/) Citizen Report Cards developed by the Public Affairs Center in Balgalore, India (http://www.citizenreportcard.com/crc/pdf/manual.pdf) Governance and Anti-Corruption Diagnostic tool. (http://go.worldbank.org/FRMDJXBY20 Global Integrity Index (http://report.globalintegrity.org/globalIndex.cfm) Trends in Corruption and Regulatory Burden in Eastern Europe and Central Asia (report) (http://go.worldbank.org/P2ARLKNWO0)
Annex – Additional slides • What is BEEPS? • Access to Finance: credit and the crisis • Infrastructure warning signs: impacts of electricity • Labor results: trends in two directions • Other issues
What is BEEPS? • A joint initiative of the European Bank for Reconstruction and Development and the World Bank • The BEEPS has been carried out in 1999, 2002, 2005, and 2008 in virtually all of the countries of ECA region • A primary goal of BEEPS is to capture indicators of the business environment and firm-state interaction (e.g. characteristics of financing, infrastructure, labor relations, red tape, corruption, innovation, judiciary, etc.) • Over 9,000 firms in 27 ECA countries were surveyed in 2005, and over 11,000 in 29 countries in the 2008 cycle. • In Serbia, 282 firms participated in 2005, 388 in 2008.
Sample & Methodology 2008 Sample for Serbia • BEEPS uses a stratified sample of firms chosen on the basis of age, primary area of activity, size, and location • The sampling frame and methodology changed between 2005 and 2008 cycles, and • While steps have been taken to match the 2005 and 2008 sample frames as closely as possible, all cross-period comparisons should be considered illustrative While cross-period comparability is limited, the “new” BEEPS allows for greater comparability of ECA countries with countries in other regions.
Progress and Opportunities: Severity of Problems Doing Business 2005 - 2008 • Corruption, Access to Finance Tax Rates and Courts remain top obstacles • Greatest progress is seen in Tax Administration (5th-9th) and Business licensing (8th – 12th) • Electricity is becoming a greater constraint (common across all ECA countries) • Skills and education of workers is also becoming a pressing issue for Serbian firms. Lower obstacle Higher obstacle Ranked by severity of obstacle in 2008
Access to Finance: Credit Use and Need Percentage of Firms Applying for a Loan and Percent of Purchases Made on Credit, 2008 • Use of credit is higher than average in Serbia: 70% of firms purchased on credit in 2008, exceeding the ECA average of 62%. • A higher percentage of Serbian firms need credit as well: 58% applied for a loan in 2007 vs. 37% in the EU-10
Unintended Consequences: Credit and the Crisis • Although access to credit is low, the lack of easy money likely mitigated the effects of the financial crisis Change in Credit to the Private Sector/GDP (04-07) vs. 2009 GDP Growth Credit to the Private Sector as a Percent of GDP, 2004-2008
Infrastructure: Warning Signs Ahead • Across ECA, electricity became the 3rd highest perceived obstacle to doing business. • 6th highest obstacle for Serbian firms • Perceptions of Telecommunications as an obstacle increased in all but 2 countries in ECA: Serbia and FYR Macedonia • Serbian firms reported greater satisfaction with telecommunications, and 91% of firms use email • There is a visible positive relationship between email use and labor productivity.
Quality of Electrical Services: Serbian Firms face less down time • Downtime is lower than average despite 57% of firms in Serbia reporting outages. Percentage of Firms Experiencing Power Outages Frequency of Power Outages in a Typical Month Average Length of Power Outages (in hours)
Quality of Electrical Services: Impacts on Sales and Productivity Percentage of Annual Sales Lost Due to Power Outages, 2008 • Serbian firms face lower losses in sales from outages than neighboring countries. • However, there is a productivity effect to these outages, particularly for lower-productivity firms • Larger firms are less vulnerable to the electricity constraint, and can mitigate effects through second best solutions (i.e. generators)
Labor Issues: Trends in Two Directions • Across ECA, perceptions of labor regulations as a problem eased from 2005-2008, falling from 9th to 13th. • In Serbia, labor regulations were the 8th highest obstacle. • At the same time, skills and education of workers became a bigger problem region wide – becoming the 4th greatest obstacle to doing business. • Ranking 5th in Serbia • There is evidence that a skills constraint is emerging in ECA, seen in the characteristics of the unemployed, and migration patterns, among other reasons such as the shift in labor demand to more highly-skilled labor. • Analysis shows that formal education may not be the answer to the skills question, but in development of relevant skills.
Enhancing Skills: Serbian Firms Provide More Training Firms Providing Training • As a response to the emerging skills constraint, 37% of Serbian firms offered training to their full-time, permanent employees. • Serbian firms train both production and non-production employees evenly. • Training may include enhancing existing skills in addition to basic skills needed to accomplish tasks. Employees Participating in Training
Summary • Across ECA, corruption continued to decline, and the regulatory and administrative burden on firms lightened. • Serbian firms follow certain regional trends: • Although corruption is the top obstacle measured by firm perceptions, reports of bribery decreased 50% or more overall and across sectors. • Access to finance remains a top obstacle, but during the year before the crisis, use and extension of credit was above average • Tax rates remained a top 3 obstacle measured by firm perceptions • Perhaps due to the immediate effect on gross profits
Summary • Perceptions of tax administration have improved, likely due to the drop in the percentage of firms inspected and lower than average time to file and pay taxes • Serbian firms reported relatively high waiting time for permits and licensing, and have a higher than average incidence of bribery for services. • Greater issues with electricity emerged • Although Serbia has a lower incidence rate, the breadth of outages is on par with the region. • Skills and education of labor became a greater obstacle, but firms in Serbia have a greater number of employees participating in training programs • Enhancing skills cultivate a more effective workforce