Download
1 / 26
300 likes | 528 Views
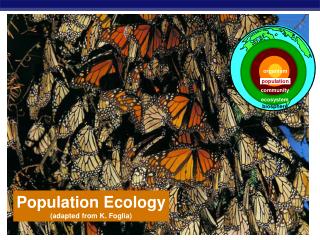
organism. population. community. ecosystem. biosphere. Population Ecology (adapted from K. Foglia). Life takes place in populations. Population group of individuals of same species in same area at same time. rely on same resources interact interbreed.

E N D
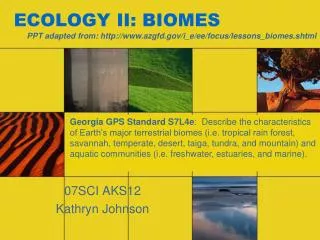
organism population community ecosystem biosphere Population Ecology (adapted from K. Foglia)
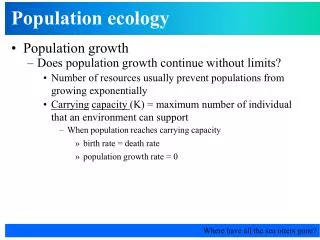
Life takes place in populations • Population • group of individuals of same species in same area at same time • rely on same resources • interact • interbreed Population Ecology: What factors affect a population?
Factors that affect Population Size • Abiotic factors • sunlight & temperature • precipitation / water • soil / nutrients • Biotic factors • other living organisms • prey (food) • competitors • predators, parasites, disease • Intrinsic factors • adaptations
aspen oak, maple sequoia white birch 15,000 years ago glacial period Present Alpine tundra Alpine tundra Spruce-fir forests 3 km Mixed conifer forest Spruce-fir forests Woodlands 2 km Elevation (km) Mixed conifer forest Grassland, chaparral, and desert scrub 1 km Woodlands Grassland, chaparral, and desert scrub 0 km Changes in range • Range expansions & contractions • changing environment result of competition
Devil’s hole pupfish Iiwi Hawaiian bird Iriomote cat Socorro isopod New Guinea tree kangaroo Catalina Island mahogany tree Northern white rhinoceros At risk populations • Endangered species • limitations to range / habitat • places species at risk
Population Spacing • Dispersal patterns within a population Provides insight into the environmental associations & social interactions of individuals in population clumped random uniform
Uniform May result from direct interactions between individuals in the population territoriality Clumped patterns
Population Size • Changes to population size • adding & removing individuals from a population • birth • death • immigration • emigration
Age structure • Relative number of individuals of each age What do these data imply about population growth in these countries?
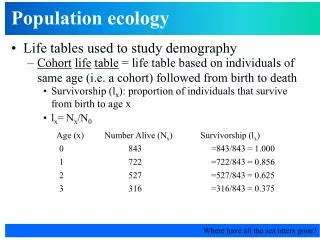
1000 Human (type I) Hydra (type II) 100 Survival per thousand Oyster (type III) 10 1 0 25 50 75 100 Percent of maximum life span Survivorship curves What do these graphs tell about survival & strategy of a species? • Generalized strategies I. High death rate in post-reproductive years II. Constant mortality rate throughout life span III. Very high early mortality but the few survivors then live long (stay reproductive)
Trade-offs: survival vs. reproduction • The cost of reproduction • increase reproduction may decrease survival • age at first reproduction • investment per offspring • number of reproductive cycles per lifetime Natural selection favors a life history that maximizes lifetime reproductive success
Reproductive strategies • K-selected • (competative) • late reproduction • few offspring • invest a lot in raising offspring • primates • coconut • r-selected • (fast reproduction) • early reproduction • many offspring • little parental care • insects • many plants K-selected r-selected
Trade offs Number & size of offspring vs. Survival of offspring or parent r-selected K-selected “Of course, long before you mature, most of you will be eaten.”
1000 Human (type I) Hydra (type II) 100 Survival per thousand Oyster (type III) 10 1 0 25 50 75 100 Percent of maximum life span Life strategies & survivorship curves K-selection r-selection
Exponential growth rate of a population • Characteristic of populations without limiting factors • introduced to a new environment or rebounding from a catastrophe Whooping crane coming back from near extinction African elephant protected from hunting
Regulation of population size marking territory= competition • Limiting factors • density dependent • competition: food, mates, nesting sites • predators, parasites, pathogens • density independent • abiotic factors • sunlight (energy) • temperature • rainfall swarming locusts competition for nesting sites
gypsy moth Introduced species • Non-native species • transplanted populations grow exponentially in new area • out-compete native species • loss of natural controls • lack of predators, parasites, competitors • reduce diversity • examples • African honeybee • gypsy moth • zebra mussel • purple loosestrife kudzu
~2 months ecological & economic damage Zebra mussel • reduces diversity • loss of food & nesting sites for animals • economic damage
1968 1978 Purple loosestrife • reduces diversity • loss of food & nesting sites for animals
Logistic rate of growth • Can populations continue to grow exponentially? Of course not! no natural controls K =carryingcapacity effect of natural controls What happens as N approaches K?
10 8 Number of breeding male fur seals (thousands) 6 4 2 0 1915 1925 1935 1945 Time (years) 500 400 Number of cladocerans (per 200 ml) 300 200 100 0 0 10 20 30 40 50 60 Time (days) Carrying capacity • Maximum population size that environment can support with no degradation of habitat • varies with changes in resources What’s going on with the plankton?
Changes in Carrying Capacity • Population cycles • predator – prey interactions At what population level is thecarrying capacity? K K
Population of… China: 1.3 billion India: 1.1 billion Significant advances in medicine through science and technology Industrial Revolution Human population growth adding 82 million/year ~ 200,000 per day! Doubling times 250m 500m = y () 500m 1b = y () 1b 2b = 80y (1850–1930) 2b 4b = 75y (1930–1975) What factors have contributed to this exponential growth pattern? 20056 billion Is the human population reachingcarrying capacity? Bubonic plague "Black Death" 1650500 million
Distribution of population growth 11 uneven distribution of population: 90% of births are in developing countries 10 high fertility 9 uneven distribution of resources: wealthiest 20% consumes ~90% of resourcesincreasing gap between rich & poor There are choices as to which future path the world takes… medium fertility 8 7 low fertility 6 World total World population in billions What is K for humans? 10-15 billion? the effect of income & education 5 4 Developing countries 3 2 1 Developed countries 0 1900 1950 2000 2050 Time
Evolutionary adaptations • Coping with environmental variation • regulators • endotherms • homeostasis • (“warm-blooded”) • conformers • ectotherms • (“cold-blooded”)