Download
1 / 56
560 likes | 743 Views
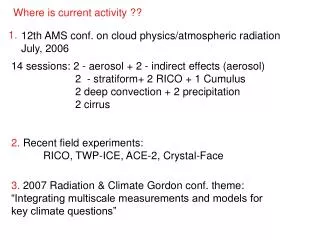
Where is current activity ??. 1. 12th AMS conf. on cloud physics/atmospheric radiation July, 2006. 14 sessions: 2 - aerosol + 2 - indirect effects (aerosol) 2 - stratiform+ 2 RICO + 1 Cumulus 2 deep convection + 2 precipitation 2 cirrus 2. Recent field experiments:

E N D
Where is current activity ?? 1. 12th AMS conf. on cloud physics/atmospheric radiation July, 2006 14 sessions: 2 - aerosol + 2 - indirect effects (aerosol) 2 - stratiform+ 2 RICO + 1 Cumulus 2 deep convection + 2 precipitation 2 cirrus 2. Recent field experiments: RICO, TWP-ICE, ACE-2, Crystal-Face 3. 2007 Radiation & Climate Gordon conf. theme: “Integrating multiscale measurements and models for key climate questions”
Presentations on: • Quantifying (measurements) aerosol, cloud nuclei & properties • (smoke, pollution) • cloud dynamic/microphysics interfaces • (cloud/dry air; drizzle dynamics; mixing; aerosol/precipitation) • subvisual cirrus • improvements on measuring the Earth’s RB from space • (inc. clouds) RT presentations de-emphasize new RT techniques, more emphasis on improved calibrations, fine-tuning coefficients and algorithms => greater accuracy, same concepts Work shifting towards data-integration, model/data synthesis, more complex scenarios (e.g. amazonian burning or mineral dust/cloud &radiation impact)
MICROSTRUCTURE OF BOUNDARY LAYER CLOUD “Parcel theory suggests that the microstructure of cumulus clouds is mainly a function of height” What does that mean ?? • during moist processes (i.e. allows for phase changes), the total water mixing ratio remains conserved: 1. Total water mixing ratio rt = rwater vapor + rliquid + rice r = water vapor/dryair ; = density As air is lifted, rwater vapor is determined by the saturation mixing ratio, which depends on the temperature. As the temperature drops, water is released from the parcel. Because everything depends on the release of water from a parcel with height, the cloud properties also are primarily a function of height.
d(rl)/dz - d(rv)/dz since r = water vapor/dryair and = density varies linearly as p/T d(rl)/dz = is roughly constant ~ 2.0-2.2 in Chilean stratus Then LWC = fadz where 0 < fad < 1
Given fad and it is possible to derive: LWP, cloud radius as f(z), cloud-top effective radius cloud vol. ext. coeff. ext(z), optical depth. => Adiabaticity is a powerful concept • instrumental constraint • application to satellite remote sensing • departure from adiabaticity indicates physical processes • microphysical processes theoretically understood (e.g. Kohler) Remarkable that it works…
Comparison of Observations and Adiabatic Model Predictions is poor OBSERVED N= 481 cm-3 <d>, s= 17.7, 7.3mm MODELED N= 467 cm-3 <d>, s= 17.9, 0.24mm Modeled distributions are too narrow.
Comparison of Observations and Adiabatic Model Predictions is poor Observed drop size distribution BROADENS w/ height; modeled Distributions NARROW RY, fig. 5.7
Arctic example May 4 • lidar-determined liquid cloud base parcel • interpolated sounding temperature structure • constrained w/ microwave radiometer-derived liquid water path adiabatic LWC 1.0 King LWC FSSP CB 0.6 Z (km) excellent correspondence between adiabatic calc. and King probe LWC 0 0.5 Liquid water content g/m^3
An aside on the FSSP (Forward-Scattering Spectrometer Probe) An optical sensor that sizes and counts drops, from which LWC is derived. The optics rely on Mie scattering: X=2pi*r/wavelength. The bigger x is, the more light is Forward-scattered.
South-eastern Pacific stratus (also Californian stratus, but not so much in north Atlantic)
Fair-weather Cumulus: how often/much they are adiabatic has been debated Kollias et al. 2001 Miami Cu had narrow (400m) adiabatic updraft region flanked by downdrafts
CORE (Hess, 1959: Holt, Rinehart, and Winston, NY)
Large resources have been devoted towards addressing how clouds mix/entrain, with adiabaticity serving to constrain or measure how much mixing is occurring • 2 field experiments (at least) devoted to this question: • Small Cumulus Microphysics Study (SCMS), FL, summer 1995 • Rain in Cumulus over Ocean (RICO), Antigua, Jan 2005
New tech. from SCMS: a fast FSSP 1hz (100m) vs 1000hz (10 cm) LWC SCMS; 28 July; 1434 PVM (XGLWC) (5. Gerber, 2000: 13th ICCP)
CONCLUSIONS • Indentification of LWCa requires a fast and accurate LWC sensor • LWCa exists in SCMS Cu • “Classical Adiabatic Cores” in SCMS Cu: none • Entrainment/mixing already starts near cloudbase (one turn-over distance) • Large LWCa parcels found only near cloud base • Above cloud base mean LWC approaches 20% of LWCa • Parcel theory, with cloud formation described by Kohler etc. Can be usefully applied to all boundary layer clouds QUESTIONS • How does entrainment/mixing affect the evolution of LWC in Cu? • What is the proper description of adiabatic cores? • What size of LWCa parcel must be considered for modeling drop spectra evolution? • Does the size and vigor of Cu affect the presence of LWCa? • Does LWCa in RICO Cu differ from other small Cu, e.g., CCOPE or SCMS?
ENTRAINMENT and MICROPHYSICS in RICO Cu Hermann Gerber NASA/GISS Workshop Sept. 2006
CONDITIONAL SAMPLING FOR ACTIVE TURRETS VERTICAL VELOCITY IS POSITIVE (~80%) IN AREA WITHLWC TOP OF CLOUD IS VISIBLE IN FORWARD-LOOKING VIDEO CLOUD IS TRAVERSED NEAR CLOUD TOP A SINGLE TURRET IS TRAVERSED (Raga, G.B., et al, 1990: J. Atmos. Sci., 47, 338-355.)
PVM FSSP Fast FSSP
Moving on to other observations….. Aircraft data across a Florida Cumulus Cloud • Higher LWC correlated w/ stronger updrafts • Downdrafts occurring at the edge • drop conc. doesn’t vary much
Moving on to other observations….. Cloud interior humidity almost always between 98% and 102% Supersaturation values typically ~ 0.1%, rarely > 0.2%
Soluble aerosol deliquesce
The supersaturation relative to a droplet(S’) is increased by two factors: • The size of a droplet (Kelvin’s Law): • For a given “bulk” supersaturation, a droplet (having a curved surface) has a lower relative supersaturation • A solution droplet (Raoult’s Law): • For a given “bulk” supersaturation, the larger amount of solute dissolved in the droplet, the higher the supersaturation relative to the droplet
Activation of CCN • Consider a rising air parcel in which the RH just increased above 100% • As the parcel continues to rise, the RH (or S) continues to increase, and solution droplets containing the largest nuclei would grow larger than r* and activate, growing into cloud droplets • The supersaturation S continues to increase and more and more of the smaller droplets are activated • As the droplets are growing, they are decreasing the amount of water vapor in the parcel, offsetting the increase in S from the rising (cooling) air parcel • At some point the cloud droplets are taking up so much vapor that S starts to decrease in the air parcel-- the max S has occurred
According to parcel theory, the conditions at cloud base determine much of the microstructure of the cloud above • Experimentalists search for relationships between the cloud base or sub-cloud layer and the cloud itself (or the lack thereof) Droplet concentration near cloud base in updrafts in marine cumuli is controlled primarily by two processes: 1. Concentration of cloud condensation nuclei (CCN) entering cloud base 2. Peak supersaturation occurring in updrafts [Twomey, 1959]
CCN Concentrations • Cleaner, more maritime air masses contain fewer aerosol particles and CCN than more polluted, continental air masses • Fewer CCN result in fewer, but larger cloud droplets, accelerating rain production
Criteria was met in clouds sampled on 12 of the 15 flights Areas Targeted Updrafts and Downdrafts; Intensity = length of arrow Criteria chosen to obtain droplet concentration 10Hz: • 600-900m above the ocean surface (nominal cloud base = 600m) • LWC > 0.25gm-3 • Updraft velocity > 0.5ms–1 • No droplets > 65 μm 260X (avoids drop shattering) • At least three consecutive data points FSSP
Vertical velocities & Droplet concentration • Vertical velocities > 0.5ms-1 between 600-900m above the ocean surface show a relationship (R = 0.66) with average droplet concentration
Vertical Velocity – a proxy for peak supersaturation • Vertical velocities > 0.5 ms-1 between 600-900 m above the ocean surface show a relationship (R = 0.79) with 100-m wind speeds
Results – Droplet Concentration Droplet concentrations between 600-900 m above ocean surface increase (R = 0.71) with 100-m wind speeds (5-14 ms-1).
CCN or peak supersaturations? • The total concentration of smaller CCN (PCASP and CN measurements) did not show a clear dependence on wind. This suggests that variability in the cloud base updraft was the most important control on the growth of drops. • The effect of more intense updrafts would be to increase the peak supersaturation, leading to activation of more cloud droplets and smaller cloud droplets near cloud base. These conclusions were based on data from the most cleanly Adiabatic cloud portions.
parcel (‘adiabatic’) theory appears able to explain some aspects of cumulus behavior, but note again that observed LWCs are often well below adiabatic values
Parcel theory also can’t explain why precipitation onset occurs so quickly. Thus observations search for clues into other mechanisms; • Factors that may be important: • Details of aerosol and CCN number concentrations, composition, sizes, including giant/ultragiant aerosol particles • Entrainment and mixing • Turbulence • Successive thermals • Preconditioning of cloud environment • “Time zero?”
Giant/Ultragiant Aerosol Particles • Giant: aerosol particles with diameters between 2 and 20 micrometers • Ultragiant: aerosol particles with diameters > 20 micrometers • Soluble, giant aerosol particles (like sea salt!) do not have to grow long by vapor diffusion to be large enough to collect smaller droplets • Ultragiant particles, if > ~45 micrometers, don’t even have to be soluble! Work based on RICO data appears to discount this mechanism (but I don’t understand the argument)
Turbulence Turbulent energy dissipation rate RY fig 5.5 Turbulence observed to increase with height, so that strongest Up/downdrafts are in top third of cloud This will increase the collision/collection rate of the drops & Can help explain a broader spectrum
Successive Thermals • Some investigators have suggested that the drops from previous thermals within the same cloud may not completely evaporate, leaving some drops behind that may then be ingested by new thermals, giving them a “head start”
Preconditioning of Cloud Environment • Numerical models of precipitation formation often start from pristine conditions in an undisturbed environment, but it is likely that earlier clouds change the local environment for the later clouds
High degree of structure in cloud field is compelling evidence (I think) of preconditioning, clouds coming and going as part of a larger convective lifecycle Good correlation between vertical and horizontal velocities also seems consistent. 600 m
Entrainment and Mixing • The mixing in of dry air from outside the cloud via the cloud’s own motions is called entrainment • It is widely acknowledged that entrainment can lead to the production of smaller particles in the droplet size distribution • It has been hypothesized that entrainment can actually lead to the production of larger drops, by significantly reducing the number of droplets in regions of the cloud that then experience less “competition” for the vapor
Mixing w/ air from aloft Total water Equivalent potential temperature Shows evidence of air from 380 mb mixing down Most compelling in env. with dry air aloft (e.g., CO, NM)
Homogeneous Mixing: All drops evaporate evenly LWC decreases; drop conc. stays the same; effective radius decreases Mixing time scale << evaporation time scale Inhomogeneous Mixing: Some drops evaporate completely, resaturating air parcel & allowing some drops to stay the same size LWC decreases; effective radius stays the same; Drop conc. decreases Parcels mix& evaporate, then more mixing
HOMOGENOUS MIXING INHOMOGENEOUS MIXING SUPER ADIABATIC ADIABATIC PEAK (Lasher-Trapp, S., W. Cooper, and A. Blyth, 2005: QJRMS, 195-220) Homogeneous mixing: all droplet size evaporate evenly. LWC decreases but N unchanged. Can’t increase drop size Inhomogeneous mixing: some drops evaporate first, resaturating Mixed-in air & allowing other drops to grow (LWC decreases)