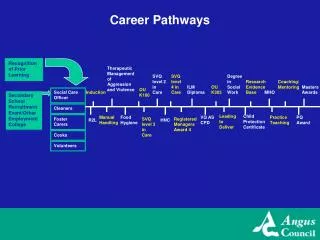
Utah Career Pathways
Utah Career Pathways. Counselors Giving Students the Edge. The Education Challenge Preparing Students for a Changing World. Challenges. Globalization (You Tube – Did You Know). Computer Sales. Computer Manufacturers. Dell Sony Compaq HP IBM Think Pad Apple NEC Gateway Toshiba.


Utah Career Pathways
E N D
Presentation Transcript
Utah Career Pathways Counselors Giving Students the Edge
The Education ChallengePreparing Students for a Changing World
Challenges • Globalization (You Tube – Did You Know)
Computer Sales Computer Manufacturers Dell Sony Compaq HP IBM Think Pad Apple NEC Gateway Toshiba Quanta Wispron Asustek Compal Inventec 90 % Mainland China Companies
Challenges • Globalization • Technology
1983 - A Nation at Risk • E-mail • Web pages • Google • iPODs • Laptops • Digital cameras • Doppler radar • Cell Phones • Debit cards
2000 • Blogs • Wikis • Tagging • Text messaging • MySpace • Podcasts • PDAs • Genetic code
Challenges • Globalization • Technology • Preparation
United States Source: Tough Choices Tough Times, National Center on Education and the Economy
What are the real school problems? • A high and rising drop out rate • Students who graduate are lacking in basic math and science skills • Most students think they are going to college but do not prepare for it or any other possible future
% of 9th Graders who complete High School 68% Source: One-Third of a Nation (ETS, 2005)
National Graduation Rates 1998 and 2001The problem of engagement
When do they leave? 9th grade 10th grade 11th grade 12th grade 5th year From Plank, forthcoming
Why they leave Source: The silent epidemic: Perspectives of high school drop outs (2006) by Civic Enterprises at www.civicenterprises.net
Here is part of the problem:Reading Performance17 year olds A Nation At Risk NAEP Scores cited in Stringfield, Castellano, & Stone, 2001
Interquartile Ranges Shown (25% - 75%) 1600 1400 2005-06 Lexile Framework® for Reading StudySummary of Text Lexile Measures 1200 Text Lexile Measure (L) 1000 800 600 High School Literature College Textbooks Military High School Textbooks Personal Use Entry-Level Occupations SAT 1, ACT, AP* College Literature * Source of National Test Data: MetaMetrics
On-the Job Lexile Requirements Lexile 1992 Adult Literacy Study 1,500 1,400 1,300 1,200 1,100 1,000 900 800 2006 International Leadership in Education Study Construction Craftsman Nurse Sales Secretary
More Problems:Science Performance17 Year Olds A Nation At Risk
The Problem: Math PerformanceOf American Youth NAEP Scores for 17 Year olds
Taking more math is no guarantee • 43% of ACT-tested Class of 20051 who earned A or B grades in Algebra II did not meet ACT College Readiness Benchmarks in math (75% chance of earning a C or better; 50% chance of earning a B or better in college math) • 25% who took more than 3 years of math did not meet Benchmarks in math (NOTE: these data are only for those who took the ACT tests) ACT, Inc. (2007) Rigor at Risk.
The number of 17-year-old students taking advanced math classes has also increased -- with 17 percent studying calculus and 53 percent studying second-year algebra -- it is unclear why that trend has not resulted in higher average math scores over all. http://nces.ed.gov/nationsreportcard/ltt/results2004/
2005-06 Quantile Framework® for Math Interquartile Ranges Shown (25% - 75%) 1500 1400 1300 1200 11th 10th 1100 Quantile Measure (Q) 1000 8th 900 800 700 600 500 Personal Use High School Employment First-Year College
6 5 4 3 2 1 Rigor/Relevance Framework Knowledge Application 1 2 3 4 5
Levels Bloom’s C D A B 6 5 4 3 2 1 2 3 4 5 1 Application
Rigor/Relevance Framework 6 • Obtain historical data about local weather to predict the chance of snow, rain, or sun during year. • Test consumer products and illustrate the data graphically. • Plan a large school event and calculate resources (food, decorations, etc.) you need to organize and hold this event. • Make a scale drawing of the classroom on grid paper, each group using a different scale. • Analyze the graphs of the perimeters and areas of squares having different-length sides. • Determine the largest rectangular area for a fixed perimeter. • Identify coordinates for ordered pairs that satisfy an algebraic relation or function. • Determine and justify the similarity or congruence for two geometric shapes. D C 5 4 3 • Calculate percentages of advertising in a newspaper. • Tour the school building and identify examples of parallel and perpendicular lines, planes, and angles. • Determine the median and mode of real data displayed in a histogram • Organize and display collected data, using appropriate tables, charts, or graphs. • Express probabilities as fractions, percents, or decimals. • Classify triangles according to angle size and/or length of sides. • Calculate volume of simple three- dimensional shapes. • Given the coordinates of a quadrilateral, plot the quadrilateral on a grid. 2 B A 1 1 2 3 4 5
Rigor/Relevance Framework 6 • Obtain historical data about local weather to predict the chance of snow, rain, or sun during year. • Test consumer products and illustrate the data graphically. • Plan a large school event and calculate resources (food, decorations, etc.) you need to organize and hold this event. • Make a scale drawing of the classroom on grid paper, each group using a different scale. • Analyze the graphs of the perimeters and areas of squares having different-length sides. • Determine the largest rectangular area for a fixed perimeter. • Identify coordinates for ordered pairs that satisfy an algebraic relation or function. • Determine and justify the similarity or congruence for two geometric shapes. D C • Express probabilities as fractions, percents, or decimals. • Classify triangles according to angle size and/or length of sides. • Calculate volume of simple three- dimensional shapes. • Given the coordinates of a quadrilateral, plot the quadrilateral on a grid. 5 4 3 • Calculate percentages of advertising in a newspaper. • Tour the school building and identify examples of parallel and perpendicular lines, planes, and angles. • Determine the median and mode of real data displayed in a histogram • Organize and display collected data, using appropriate tables, charts, or graphs. 2 B A 1 1 2 3 4 5
Rigor/Relevance Framework 6 • Obtain historical data about local weather to predict the chance of snow, rain, or sun during year. • Test consumer products and illustrate the data graphically. • Plan a large school event and calculate resources (food, decorations, etc.) you need to organize and hold this event. • Make a scale drawing of the classroom on grid paper, each group using a different scale. • Analyze the graphs of the perimeters and areas of squares having different-length sides. • Determine the largest rectangular area for a fixed perimeter. • Identify coordinates for ordered pairs that satisfy an algebraic relation or function. • Determine and justify the similarity or congruence for two geometric shapes. • Calculate percentages of advertising in a newspaper. • Tour the school building and identify examples of parallel and perpendicular lines, planes, and angles. • Determine the median and mode of real data displayed in a histogram • Organize and display collected data, using appropriate tables, charts, or graphs. D C 5 4 3 • Express probabilities as fractions, percents, or decimals. • Classify triangles according to angle size and/or length of sides. • Calculate volume of simple three- dimensional shapes. • Given the coordinates of a quadrilateral, plot the quadrilateral on a grid. 2 B A 1 1 2 3 4 5
Input to Brain Quad A Sight Hearing
Connections / Pathways Association Area Quad C Sight Hearing
Connections / Pathways Association Area Quad C Prefrontal Cortex Sight Quad B / D Hearing
Connections / Pathways Prefrontal Cortex Sight Hearing
Application Model 1.Knowledge in one discipline 2. Application within discipline 3. Application across disciplines 4. Application to real-world predictable situations 5. Application to real-world unpredictable situations
CTE • • For students who want to “do” things • Adds relevance to instruction • Strengthens academic achievement
Career and Technical Education • Keeps youth in school! • school! • Improves daily attendance • Improves graduation rate • Is an economic value! • Connects to post-secondary education! • Enhances academic achievement! NRCCTE
CTE Structures and Pedagogies and Dropping Out • Students in or Career Majors are 16% more likely to graduate from high school. • Students in Tech Prep are 30% more likely to complete high school. • Students who participated in specific STW activities are 18% more likely to complete high school. Stone & Aliaga, in press
No WBL; 2.99 college GPA No community service; 3.02 college GPA 58% with NO HS WBL; college GPA above 3.0 HS WBL; 3.08 college GPA Community service; 3.11 college GPA 64% of with HS WBL; college GPA above 3.0 CTE-WBL and Achievement: Relationships Swail, Watson S., and Kampits, Eva (2004). Work-Based Learning and Higher Education: A Research Perspective. Washington, DC: Educational Policy Institute, Inc.
Our mission Career and Technical Education (CTE)creates pathways to success for every secondary student by providing him or her with the technical skills and academic knowledge needed to prepare for future employment and/or a successful transition to post-secondary education.
Academic Skills Taught For example: Technical readingis required in testing and diagnosis in Automotive Technology. Writing skills, critical in every career, are taught throughout high school. An increased knowledge of science is essential in such careers as Agriculture and Health Care. Students apply math skills in Engineering and Construction.
Employability Skills Taught • Communication • Teamwork • Leadership • Goal setting • Resource management • Using technology • Personal responsibility • Higher-order thinking
Who takes CTE courses? Students enrolled in CTE courses include: 72,856 males 140,6519th-12th graders 67,795 females
Student Participation in Utah Over 139,000students participate in internships,job shadowing, field studies, andcareer fairs annually. Over 57,000concurrent enrollment credit hours were earned last yearby CTE students.
Only 20% of all jobs are in professions JOBS Only 15% are unskilled 65% of all jobs are skilled occupations Career Outlook Source: U.S. Dept. of Labor
What do students need to succeed? Employability skills Academic skills Technical skills
Skill Certificates Number of Skills Tests Administered YearTests 2006-2007 188,412 2005-2006 182,144 2004-2005 165,792 In 2006-2007, 132,440 studentsattained a substantial or sufficient level on the CTE competency skill certificate tests. Student performance is part of the skill certificate process.