Download
1 / 1
10 likes | 94 Views
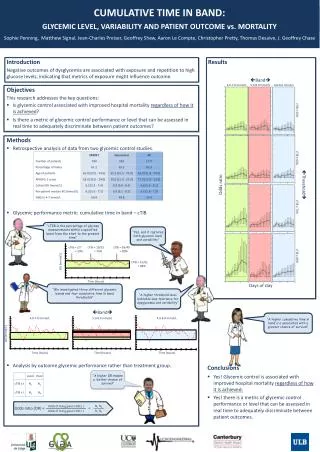
This research explores the correlation between glycemic control, cumulative time in band (cTIB), and hospital mortality, emphasizing the significance of maintaining specific blood glucose levels for better patient outcomes. Results show that higher cTIB is associated with improved survival rates, regardless of how glycemic control is achieved.

E N D
CUMULATIVE TIME IN BAND: GLYCEMIC LEVEL, VARIABILITY AND PATIENT OUTCOME vs. MORTALITY Sophie Penning, Matthew Signal, Jean-Charles Preiser, Geoffrey Shaw, Aaron Le Compte, Christopher Pretty, Thomas Desaive, J. Geoffrey Chase Introduction Results • “A higher OR means a better chance of survival” Negative outcomes of dysglycemia are associated with exposure and repetition to high glucose levels, indicating that metrics of exposure might influence outcome. Band 4.0-7.0 mmol/L 5.0-8.0 mmol/L 4.0-8.0 mmol/L Odds ratio Threshold cTIB ≥ 50% Objectives • This research addresses the key questions: • Is glycemic control associated with improved hospital mortality regardless of how it is achieved? • Is there a metric of glycemic control performance or level that can be assessed in real time to adequately discriminate between patient outcomes? cTIB ≥ 60% Methods • Retrospective analysis of data from two glycemic control studies. • Glycemic performance metric: cumulative time in band – cTIB • Analysis by outcome glycemic performance rather than treatment group. cTIB ≥ 70% • “cTIB is the percentage of glucose measurements within a specified band from the start to the present time” • “Yes, and it captures both glycemic level and variability” cTIB ≥ 80% Days of stay • “We investigated three different glycemic bands and four cumulative time in band thresholds” 4.0-7.0 mmol/L 5.0-8.0 mmol/L 4.0-8.0 mmol/L • “A higher threshold level indicates less tolerance for dysglycemia and variability” BG (mmol/L) Conclusions Band • Yes! Glycemic control is associated with improved hospital mortality regardless of how it is achieved. • Yes! there is a metric of glycemic control performance or level that can be assessed in real time to adequately discriminate between patient outcomes. • “A higher cumulative time in band is a associated with a greater chance of survival” Time (hours) Time (hours) Time (hours) cTIB = 2/7 = 29% cTIB = 19/25 = 76% cTIB = 39/49 = 80% BG (mmol/L) cTIB = 51/61 = 84% Odds ratio (OR) = = Time (hours)