Download
1 / 33
350 likes | 558 Views
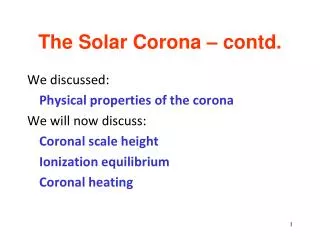
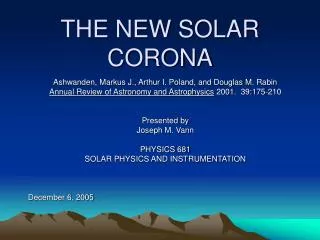
Spectroscopy of the solar Transition Region and Corona. L. Teriaca. The Solar Corona. Composite photo of the August 11, 1999 total eclipse. Lake Hazar, Turkey. The Solar Corona. Raw spectra obtained on 19 June 1936 during a total eclipse observed from the former Soviet Union.

E N D
Spectroscopy of the solar Transition Region and Corona L. Teriaca L. Teriaca, IMPRS Seminar, Lindau 08/12/04
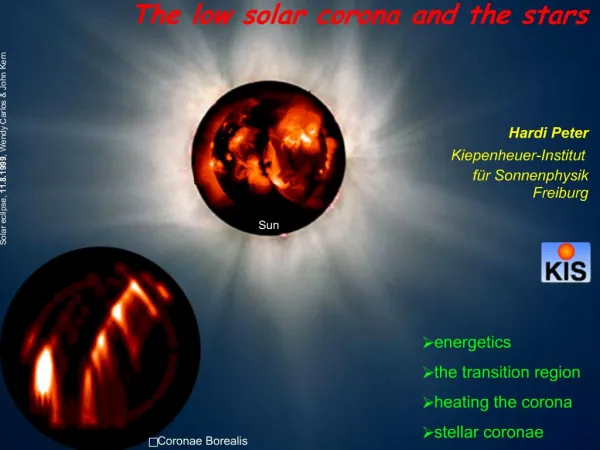
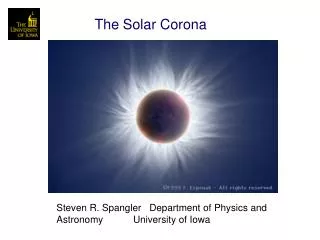
The Solar Corona Composite photo of the August 11, 1999 total eclipse. Lake Hazar, Turkey. L. Teriaca, IMPRS Seminar, Lindau 08/12/04
The Solar Corona Raw spectra obtained on 19 June 1936 during a total eclipse observed from the former Soviet Union. Te=1 – 2 MK L. Teriaca, IMPRS Seminar, Lindau 08/12/04
The Solar Chromosphere Te=104 K Photo of the August 11, 1999 total eclipse. Kastamonu, Turkey. L. Teriaca, IMPRS Seminar, Lindau 08/12/04
The Solar Transition Region L. Teriaca, IMPRS Seminar, Lindau 08/12/04
Radiant power density Optically thin plasma Spectral radiant power density: Radiant power density: L. Teriaca, IMPRS Seminar, Lindau 08/12/04
Radiant power density L. Teriaca, IMPRS Seminar, Lindau 08/12/04
Radiant power density Normalised radiant power density Contribution function L. Teriaca, IMPRS Seminar, Lindau 08/12/04
Line radiance L. Teriaca, IMPRS Seminar, Lindau 08/12/04
Differential emission measure L. Teriaca, IMPRS Seminar, Lindau 08/12/04
Atomic processes Characteristic times for the relevant atomic processes in the Transition region as calculated for the C IV line at 154.8 nm (Te=105 K, Ne=1010 cm−3). L. Teriaca, IMPRS Seminar, Lindau 08/12/04
Thermal equilibrium L. Teriaca, IMPRS Seminar, Lindau 08/12/04
Ionization (Nion/Nel) q collisional ionization αr radiative recombination αd dielectronic recombination L. Teriaca, IMPRS Seminar, Lindau 08/12/04
Ionisation (Nion/Nel) L. Teriaca, IMPRS Seminar, Lindau 08/12/04
Excitation (Nj/Nion) L. Teriaca, IMPRS Seminar, Lindau 08/12/04
Collisional rate coefficients L. Teriaca, IMPRS Seminar, Lindau 08/12/04
Excitation (Nj/Nion) L. Teriaca, IMPRS Seminar, Lindau 08/12/04
Excitation (Nj/Nion) CHIANTI atomic database: http:wwwsolar.nrl.navy.mil/chianti.html L. Teriaca, IMPRS Seminar, Lindau 08/12/04
Abundance (Nel/NH) L. Teriaca, IMPRS Seminar, Lindau 08/12/04
Two – level atom u g Ng=Nion L. Teriaca, IMPRS Seminar, Lindau 08/12/04
Formation temperature L. Teriaca, IMPRS Seminar, Lindau 08/12/04
T = 0.7×10⁴K T = 1.8×10⁵K T = 2.5×10⁵K L. Teriaca, IMPRS Seminar, Lindau 08/12/04
T = 1.4×10⁶K T = 1.0×10⁶K T = 2.5×10⁵K T = 1.8×10⁵K T ≈ 104K L. Teriaca, IMPRS Seminar, Lindau 08/12/04
Emission Measure L. Teriaca, IMPRS Seminar, Lindau 08/12/04
Electron density Density sensitive line radiance ratio → f=10−2– 10−5 L. Teriaca, IMPRS Seminar, Lindau 08/12/04
Banerjee, Teriaca, Doyle, Wilhelm, 1998, A&A 339, 208 Coronaldensities L. Teriaca, IMPRS Seminar, Lindau 08/12/04
Electron temperatures If we consider an isothermal plasma, the ratio of two allowed transitions from adjacent ionization stages reduces to the ratio of their contribution functions. If we consider two allowed transitions from the ground state of the same ion: sensitive to the temperature if: L. Teriaca, IMPRS Seminar, Lindau 08/12/04
Line profile In the solar corona: Assuming that the ions follow a Maxwellian distribution: where: L. Teriaca, IMPRS Seminar, Lindau 08/12/04
Line profile As an example, for N V 123.8 nm, (Te=1.8×10⁵ K), However, we observe: L. Teriaca, IMPRS Seminar, Lindau 08/12/04
Non–thermal velocity Teriaca, Banerjee, Doyle, 1999, A&A, 349, 636 L. Teriaca, IMPRS Seminar, Lindau 08/12/04
Doppler shift Teriaca, Banerjee, Doyle, 1999, A&A, 349, 636 L. Teriaca, IMPRS Seminar, Lindau 08/12/04
Chromospheric evaporation in flares L. Teriaca et al. Large upflows in CDS Fe XIX line at the footpoints of the flaring loop system during the impulsive phase. Red contours indicate Hα downflows of ≈10 km s−1 RHESSI data, starting at 14:50 UT, shows non thermal emission still present at the right footpoint One hour later the flaring loops start to appear in the TRACE 17.1 nm band and are fully visible around 16:20 UT. L. Teriaca, IMPRS Seminar, Lindau 08/12/04
Supersonic flows in a Quiet Sun loop L. Teriaca et al. 2004, A&A 427, 1065 a) O VISUMER raster of a small QS area. Black contours show magnetic flux of −10, −25, −40 G. Black + indicate the locations of strong non–Gaussian line profiles. The dashed red line indicates the projection on the plane of the sky of a semicircular loop with a diameter of 13". The black dots show the position of the observed loop. b, d) Profiles on the legs of the loop with the results of a 3 component Gaussian fitting. c) Profile at loop top. The dotted line shows the average QS profile times 4.9. Observed speeds are consistent with the LOS component of a supersonic siphon–like flow of ≈130 km s−1 along theloop. L. Teriaca, IMPRS Seminar, Lindau 08/12/04