Introduction to Statistical Inference via Randomization Testing
0 likes | 13 Views
This introductory material covers the concept of statistical inference through randomization testing. It discusses setting up competing claims, creating randomization distributions, calculating p-values, and making conclusions based on the observed data. The application exercise explores hypotheses related to yawning contagion and caffeine's influence on tapping rate, providing a practical understanding of frequentist inference methods.

Introduction to Statistical Inference via Randomization Testing
E N D
Presentation Transcript
Unit 1: Introduction todata 4. Introduction to statisticalinference Sta 101 - Fall 2019 Duke University, Department of Statistical Science Dr. Ellison Slides posted at https://www2.stat.duke.edu/courses/Fall19/sta101.001/

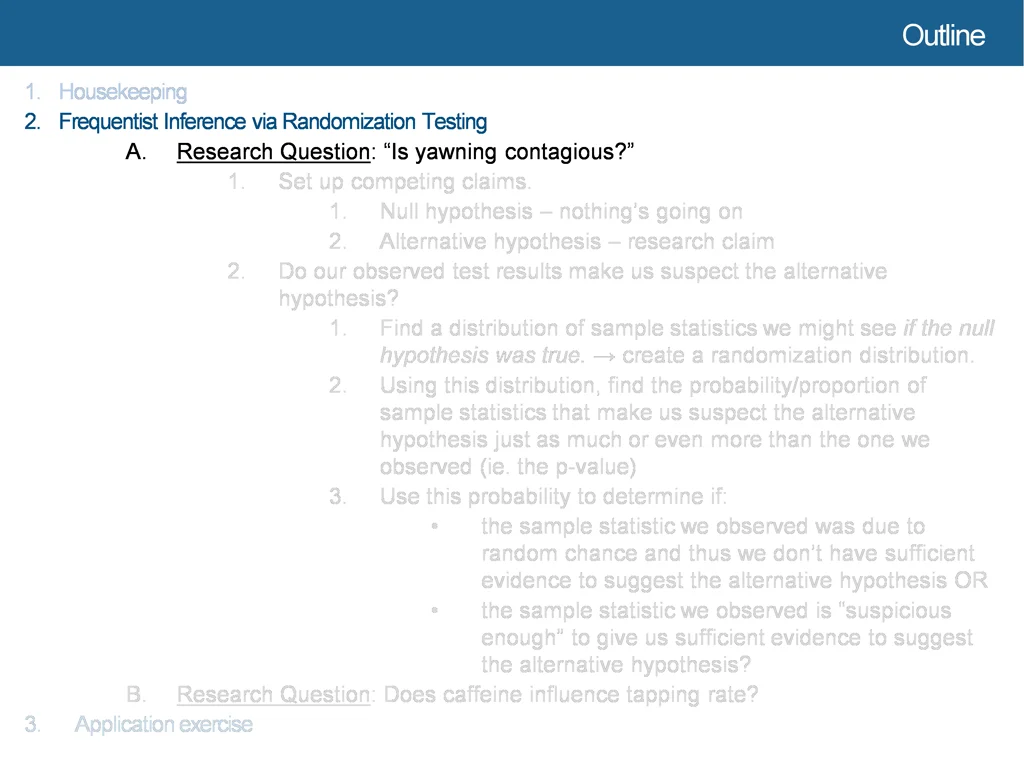
Outline 1. Housekeeping 2. Frequentist Inference via Randomization Testing A. Research Question: “Is yawning contagious?” 1. Set up competing claims. 1. 2. 2. Do our observed test results make us suspect the alternative hypothesis? 1. Find a distribution of sample statistics we might see if the null hypothesis was true. → create a randomization distribution. 2. Using this distribution, find the probability/proportion of sample statistics that make us suspect the alternative hypothesis just as much or even more than the one we observed (ie. the p-value) 3. Use this probability to determine if: • the sample statistic we observed was due to random chance and thus we don’t have sufficient evidence to suggest the alternative hypothesis OR • the sample statistic we observed is “suspicious enough” to give us sufficient evidence to suggest the alternative hypothesis? B. Research Question: Does caffeine influence tapping rate? 3. Applicationexercise Null hypothesis – nothing’s going on Alternative hypothesis – research claim

Announcements Coming up… ▶ Problem Set 1 is due Friday 9/6(11:55pm) ▶ Readiness Assessment 2 is Monday 9/9, start reviewing Unit 2 videos ▶ We will start grading for clickers on Monday!

Outline 1. Housekeeping 2. Frequentist Inference via Randomization Testing A. Research Question: “Is yawning contagious?” 1. Set up competing claims. 1. 2. 2. Do our observed test results make us suspect the alternative hypothesis? 1. Find a distribution of sample statistics we might see if the null hypothesis was true. → create a randomization distribution. 2. Find the p-value: Using this distribution, find the probability/proportion of sample statistics that make us suspect the alternative hypothesis just as much or even more than the one we observed. 3. Make a conclusion: • P-value high: the sample statistic we observed was due to random chance and thus we don’t have sufficient evidence to suggest the alternative hypothesis OR • P-value low: the sample statistic we observed is “suspicious enough” to give us sufficient evidence to suggest the alternative hypothesis? B. Research Question: Does caffeine influence tapping rate? 3. Applicationexercise Null hypothesis – nothing’s going on Alternative hypothesis – research claim Intuition for Frequentist Inference

Outline First, let’s develop an intuition for frequentist inference. Research Question: Is yawning contagious?

? ✋ Is yawningcontagious? An experiment conducted by the MythBusters tested if a person can be subconsciously influenced into yawning if another person nearthem yawns. https://www.youtube.com/watch?v=bCCCxV3nNgs&feature=youtu.be

Outline What are the variables in this research question? • Which is the independent and which is the dependent variable? • Are these variables categorical or numerical? Population and Sample • What is the population and sample in this study? What population parameters and sample statistics are we interested in? Study Type • Is this an experiment or an observational study?

Outline Original Sample Data Collected Tabulating Data

? ✋ Experimentsummary 50 people were randomly assigned to two groups: ▶ treatment: see someone yawn, n = 34 ▶ control: don’t see someone yawn, n = 16 Treatment Control Total Yawn 10 4 14 Not Yawn 24 12 36 Total 34 16 50 % Yawners

? ✋ Experimentsummary 50 people were randomly assigned to two groups: ▶ treatment: see someone yawn, n = 34 ▶ control: don’t see someone yawn, n = 16 Treatment Control Total Yawn 10 4 14 Not Yawn 24 12 36 Total 34 16 50 10= 0.29 34 4= 0.25 16 % Yawners ???? ???? ?????? ??? ????
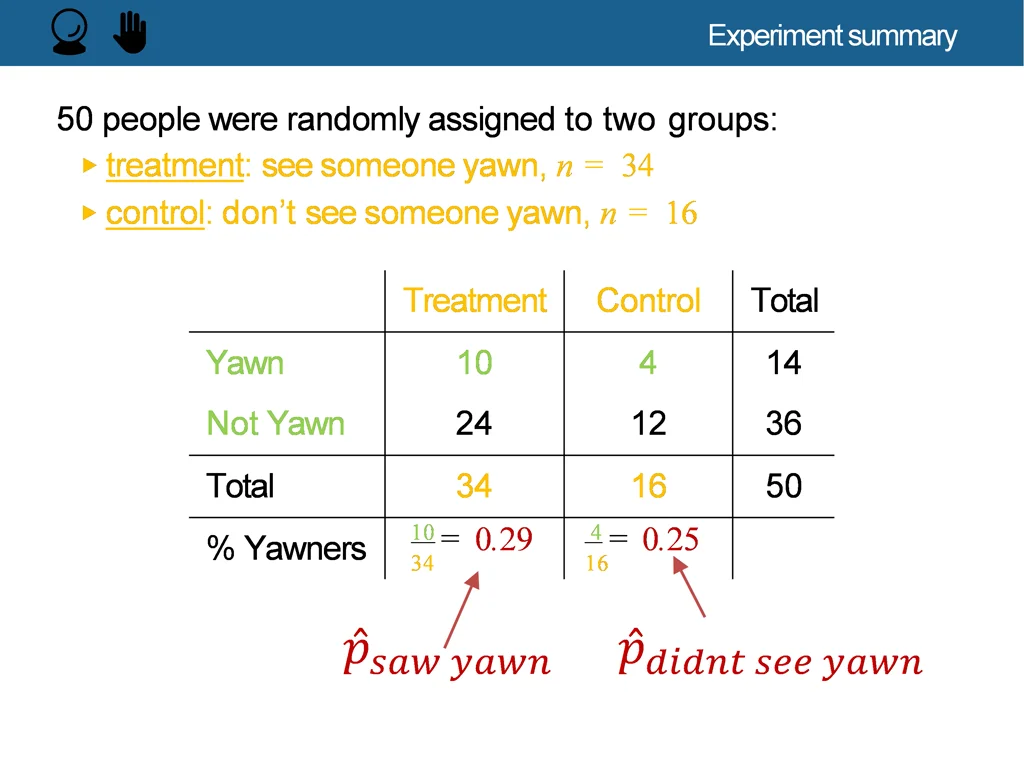
? ✋ Experimentsummary Treatment (Saw a Yawn) Control (Didn’t see a Yawn) ?????? ??? ????= 0.25 ???? ????= 0.29 % Yawners ???? ????− ?????? ??? ???? = 4% Difference!

Outline Interpreting 4% Difference: Is a difference of 4% big enough to suggest yawning is contagious? A large sample proportion difference would make us suspect that yawning is contagious, but is 4% actually large compared to differences we might observe due to random chance? OR Could it be the case that yawning is NOT contagious and a 4% or more difference was just due to random chance?

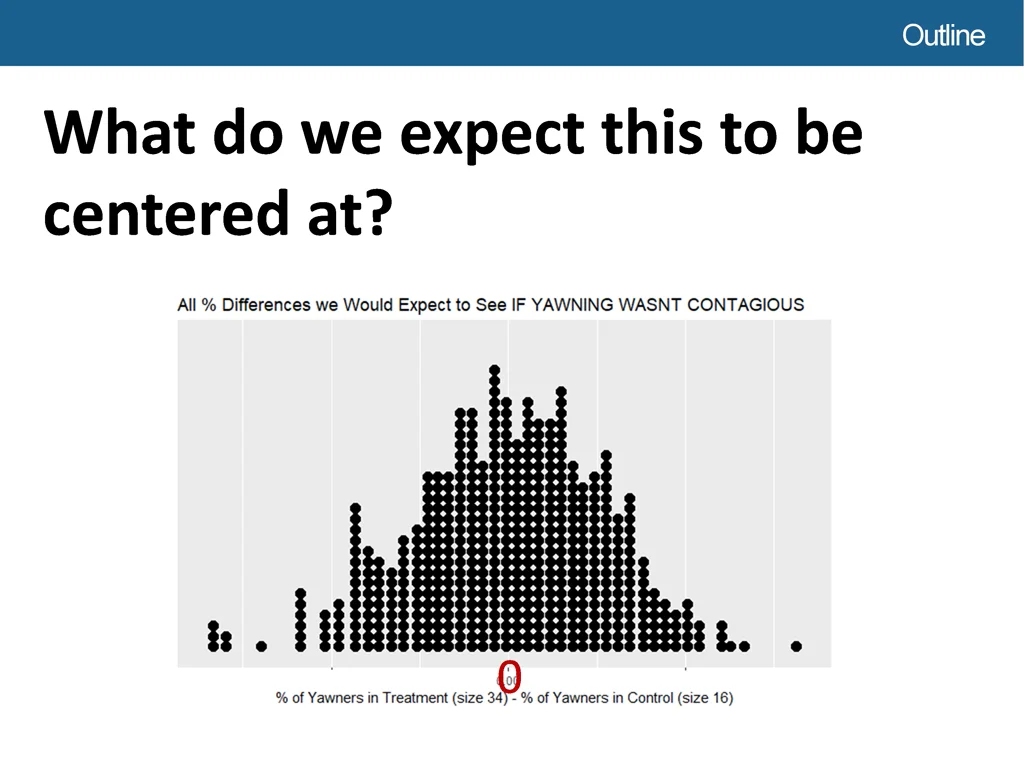
Outline What do we expect this to be centered at?

Outline What do we expect this to be centered at? 0
Outline Interpreting 4% Difference: What if we had this information? or more big enough to suggest yawning is contagious? Is a difference of 4% OR Could it be the case that yawning is NOT contagious and a 4% or more difference was just due to random chance?

Outline Interpreting 4% Difference: What if we had this information? or more big enough to suggest yawning is contagious? Is a difference of 4% OR Could it be the case that yawning is NOT contagious and a 4% or more difference was just due to random chance? 0.04
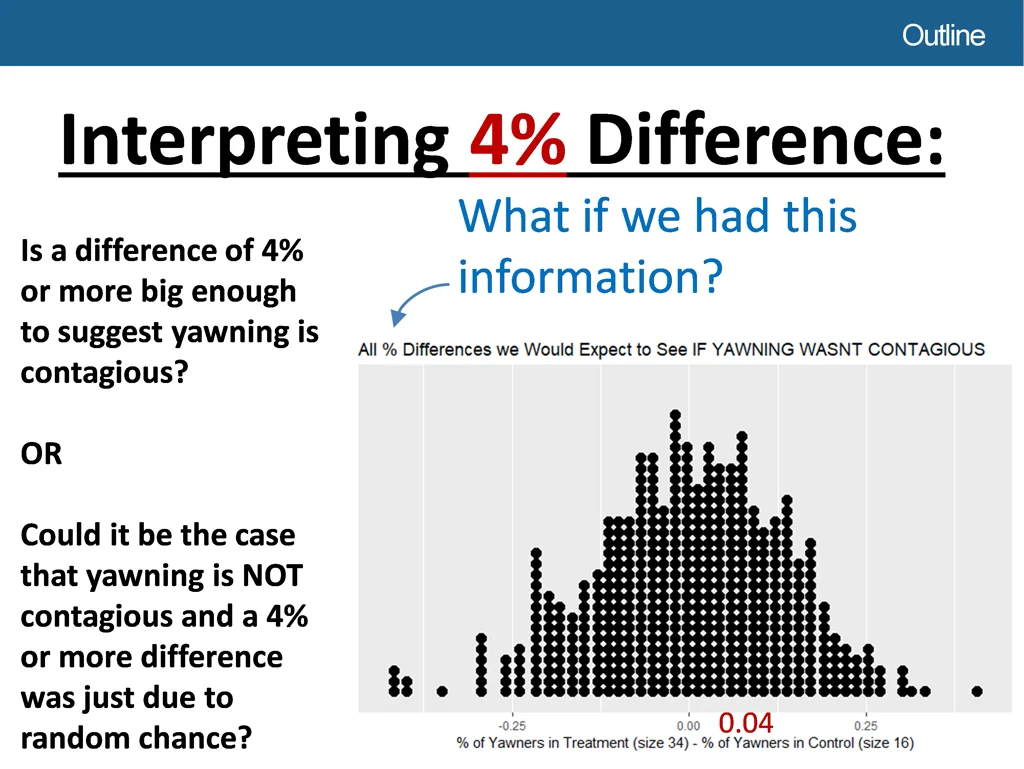
Outline Interpreting 4% Difference: What if we had this information? or more big enough to suggest yawning is contagious? Is a difference of 4% OR Could it be the case that yawning is NOT contagious and a 4% or more difference was just due to random chance? 0.04

Outline Interpreting 4% Difference: What if we had this information? • A large proportion of possible sample proportion differences are equally large or even larger than the one we observed (4%). • There is NOT enough evidence to suggest that yawning is contagious and a 4% or more difference could just be due to random chance. 0.04

Outline Interpreting 4% Difference: What if we had this information? or more big enough to suggest yawning is contagious? Is a difference of 4% OR Could it be the case that yawning is NOT contagious and a 4% or more difference was just due to random chance?

Outline Interpreting 4% Difference: What if we had this information? or more big enough to suggest yawning is contagious? Is a difference of 4% OR Could it be the case that yawning is NOT contagious and a 4% or more difference was just due to random chance? 0.04

Outline Interpreting 4% Difference: What if we had this information? or more big enough to suggest yawning is contagious? Is a difference of 4% OR Could it be the case that yawning is NOT contagious and a 4% or more difference was just due to random chance? 0.04
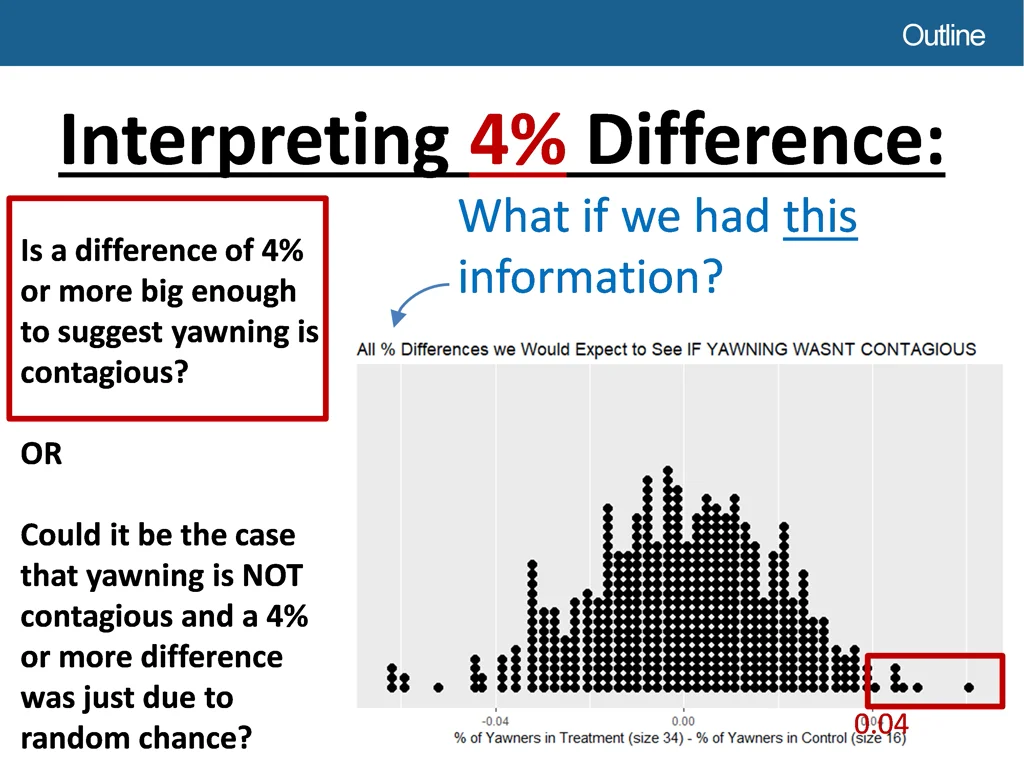
Outline Interpreting 4% Difference: What if we had this information? possible sample proportion differences are equally large or even larger than the one we observed (4%). • A small proportion of • A difference of 4% or more is big enough to suggest yawning is contagious. 0.04

Outline 1. Housekeeping 2. Frequentist Inference via Randomization Testing A. Research Question: “Is yawning contagious?” 1. Set up competing claims. 1. 2. 2. Do our observed test results make us suspect the alternative hypothesis? 1. Find a distribution of sample statistics we might see if the null hypothesis was true. → create a randomization distribution. 2. Find the p-value: Using this distribution, find the probability/proportion of sample statistics that make us suspect the alternative hypothesis just as much or even more than the one we observed. 3. Make a conclusion: • P-value high: the sample statistic we observed was due to random chance and thus we don’t have sufficient evidence to suggest the alternative hypothesis OR • P-value low: the sample statistic we observed is “suspicious enough” to give us sufficient evidence to suggest the alternative hypothesis? B. Research Question: Does caffeine influence tapping rate? 3. Applicationexercise Null hypothesis – nothing’s going on Alternative hypothesis – research claim Randomization Testing: a type of Frequentist Inference

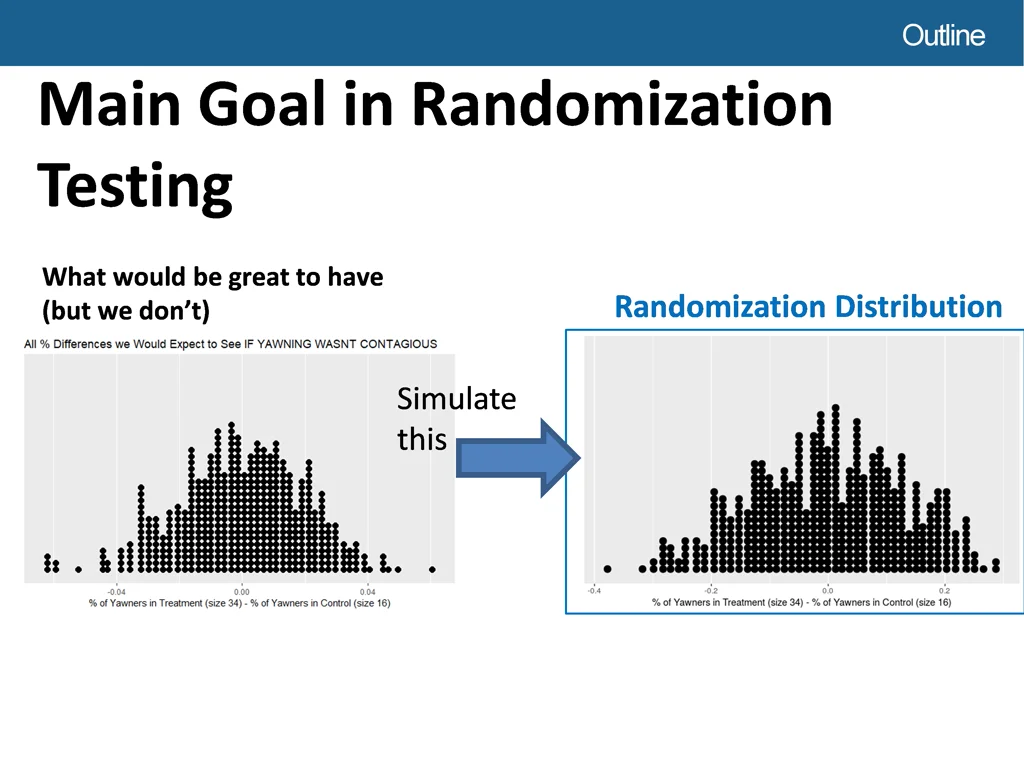
Outline Main Goal in Randomization Testing What would be great to have (but we don’t) Randomization Distribution Simulate this
Outline 1. Housekeeping 2. Frequentist Inference via Randomization Testing A. Research Question: “Is yawning contagious?” 1. Set up competing claims. 1. 2. 2. Do our observed test results make us suspect the alternative hypothesis? 1. Find a distribution of sample statistics we might see if the null hypothesis was true. → create a randomization distribution. 2. Using this distribution, find the probability/proportion of sample statistics that make us suspect the alternative hypothesis just as much or even more than the one we observed (ie. the p-value) 3. Use this probability to determine if: • the sample statistic we observed was due to random chance and thus we don’t have sufficient evidence to suggest the alternative hypothesis OR • the sample statistic we observed is “suspicious enough” to give us sufficient evidence to suggest the alternative hypothesis? B. Research Question: Does caffeine influence tapping rate? 3. Applicationexercise Null hypothesis – nothing’s going on Alternative hypothesis – research claim
Outline Main Goal in Randomization Testing (for inferring relationships between two variables) Randomization Distribution Step 0: Set up two competing claims/hypotheses • Null hypothesis • Alternative hypothesis Step 1: Generate a Randomization Distribution: Generate a simulated histogram or dot plot that shows us the expected differences in sample statistics we might if the null hypothesis were true. 4% Step 2: Find the p-value: Using this randomization distribution, find the probability/proportion of sample statistic differences that make us suspect the alternative hypothesis just as much or even more than the one we observed. Step 3: Make a conclusion: • Large p-value → the sample statistic difference we observed was due to random chance and thus we don’t have sufficient evidence to suggest the alternative hypothesis. • Small p-value → the sample statistic difference we observed is “suspicious enough” to give us sufficient evidence to suggest the alternative hypothesis.

Outline Now, let’s perform randomization testing for the yawning experiment!

Outline 1. Housekeeping 2. Frequentist Inference via Randomization Testing A. Research Question: “Is yawning contagious?” 1. Set up competing claims. 1. 2. 2. Do our observed test results make us suspect the alternative hypothesis? 1. Find a distribution of sample statistics we might see if the null hypothesis was true. → create a randomization distribution. 2. Find the p-value: Using this distribution, find the probability/proportion of sample statistics that make us suspect the alternative hypothesis just as much or even more than the one we observed. 3. Make a conclusion: • P-value high: the sample statistic we observed was due to random chance and thus we don’t have sufficient evidence to suggest the alternative hypothesis OR • P-value low: the sample statistic we observed is “suspicious enough” to give us sufficient evidence to suggest the alternative hypothesis? B. Research Question: Does caffeine influence tapping rate? 3. Applicationexercise Null hypothesis – nothing’s going on Alternative hypothesis – research claim Randomization Testing: a type of Frequentist Inference

Outline Randomization Testing Step 0: How do we set up null and alternative hypotheses? Ho: _________ Ha: _________

? ✋ Two competingclaims Ho: Null Hypothesis "There is nothing going on." "There is something going on." Seeing someone yawn and yawning are independent. Seeing someone yawn and yawning are dependent. Interpretations In the population there is no difference in the proportions of yawners who did and did not see a yawn. ???? ????= ?????? ??? ???? In the population the proportion of yawners who did see a yawn is greater than those who didn’t. ???? ????> ?????? ??? ???? The observed difference in the proportion of yawners in the treatment and control is simply due to chance. The observed difference in the proportion of yawners in the treatment and control is not due to chance.

? ✋ Two competingclaims Ho: Null Hypothesis Ha: Alternative Hypothesis "There is nothing going on." "There is something going on." Seeing someone yawn and yawning are independent. Seeing someone yawn and yawning are dependent. Interpretations In the population there is no difference in the proportions of yawners who did and did not see a yawn. ???? ????= ?????? ??? ???? In the population the proportion of yawners who did see a yawn is greater than those who didn’t. ???? ????> ?????? ??? ???? The observed difference in the proportion of yawners in the treatment and control is simply due to chance. The observed difference in the proportion of yawners in the treatment and control is not due to chance.

Outline Randomization Testing Step 0: Set up null and alternative hypotheses. Ho: ???? ????= ?????? ??? ???? Ha: ???? ????> ?????? ??? ????

? ✋ ? Hypothesis testing is natural Step 0: Formulate hypotheses/claims. H0: Your partner isn’t cheating. HA: Your partner is cheating.

? ✋ ? Hypothesis testing is natural Step 0: Formulate hypotheses/claims. H0: Your partner isn’t cheating. HA: Your partner is cheating. Steps 1 and 2: Judge the evidence: “Could these data plausibly have happened by chance if the null hypothesis were true?” Evidence: • Partner isn’t saying your name on the phone. Partner isn’t saying “I love you” on the phone. Every other word is “uh huh… yeah ok” on the phone. … • • •

? ✋ ? Hypothesis testing is natural Step 0: Formulate hypotheses/claims. H0: Your partner isn’t cheating. HA: Your partner is cheating. Steps 1 and 2: Judge the evidence: “Could these data plausibly have happened by chance if the null hypothesis were true?” Evidence: • Partner isn’t saying your name on the phone. Partner isn’t saying “I love you” on the phone. Every other word is “uh huh… yeah ok” on the phone. … • Step 3: Make a decision: • If “nothing is going on”, this evidence would be highly unlikely. There is enough evidence to suggest your partner cheating. OR • If “nothing is going on”, this evidence would not be too uncommon. There isn’t enough evidence to suggest your partner cheating. • • Judge the Evidence • Shady!

Outline 1. Housekeeping 2. Frequentist Inference via Randomization Testing A. Research Question: “Is yawning contagious?” 1. Set up competing claims. 1. 2. 2. Do our observed test results make us suspect the alternative hypothesis? 1. Find a distribution of sample statistics we might see if the null hypothesis was true. → create a randomization distribution. 2. Find the p-value: Using this distribution, find the probability/proportion of sample statistics that make us suspect the alternative hypothesis just as much or even more than the one we observed. 3. Make a conclusion: • P-value high: the sample statistic we observed was due to random chance and thus we don’t have sufficient evidence to suggest the alternative hypothesis OR • P-value low: the sample statistic we observed is “suspicious enough” to give us sufficient evidence to suggest the alternative hypothesis? B. Research Question: Does caffeine influence tapping rate? 3. Applicationexercise Null hypothesis – nothing’s going on Alternative hypothesis – research claim Randomization Testing: a type of Frequentist Inference

? ✋ Generating the Randomization Distribution (for inferring relationships between two variables) Simulationsetup 1. Write the dependent variable values from the sample data on index cards. 2. Do the following many times: a) Shuffle the index cards 7 times. b) Deal the index cards into two groups: a) “Treatment Group” (# of cards = Treatment Group Size) b) “Control Group” (# of cards = Control Group Size) c) Note the difference in sample statistics between the treatment and control groups and plot the difference in a dot plot. Randomization Distribution

? ✋ Generating the Randomization Distribution (for inferring relationships between two variables) Simulationsetup 1. Write the dependent variable values from the sample data on index cards (50 cards = yawning experiment sample size =total number of actors) 14 Say yawn, 36 say not yawn 2. Do the following many times: a) Shuffle the index cards 7 times. b) Deal the index cards into two groups: a) “Treatment Group” (# of cards = Treatment Group Size) b) “Control Group” (# of cards = Control Group Size) c) Note the difference in proportionsbetween the treatment and control groups and plot the difference in a dot plot. Randomization Distribution
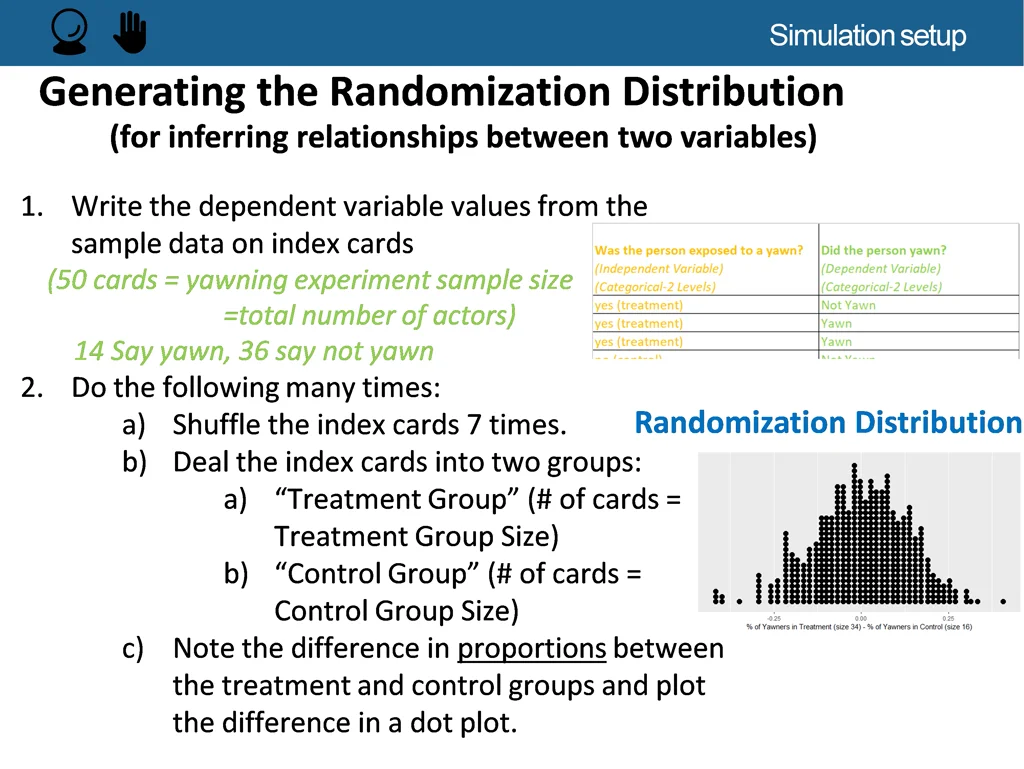
? ✋ Generating the Randomization Distribution (for inferring relationships between two variables) Simulationsetup 1. Write the dependent variable values from the sample data on index cards (50 cards = yawning experiment sample size =total number of actors) 14 Say yawn, 36 say not yawn 2. Do the following many times: a) Shuffle the index cards 7 times. b) Deal the index cards into two groups: a) “Treatment Group” (# of cards = 34) Randomization Distribution b) “Control Group” (# of cards = 16) c) Note the difference in proportions(of yawn cards) between the treatment and control groups and plot the difference in a dot plot.

Outline What do we expect this randomization distribution to be centered at? Randomization Distribution
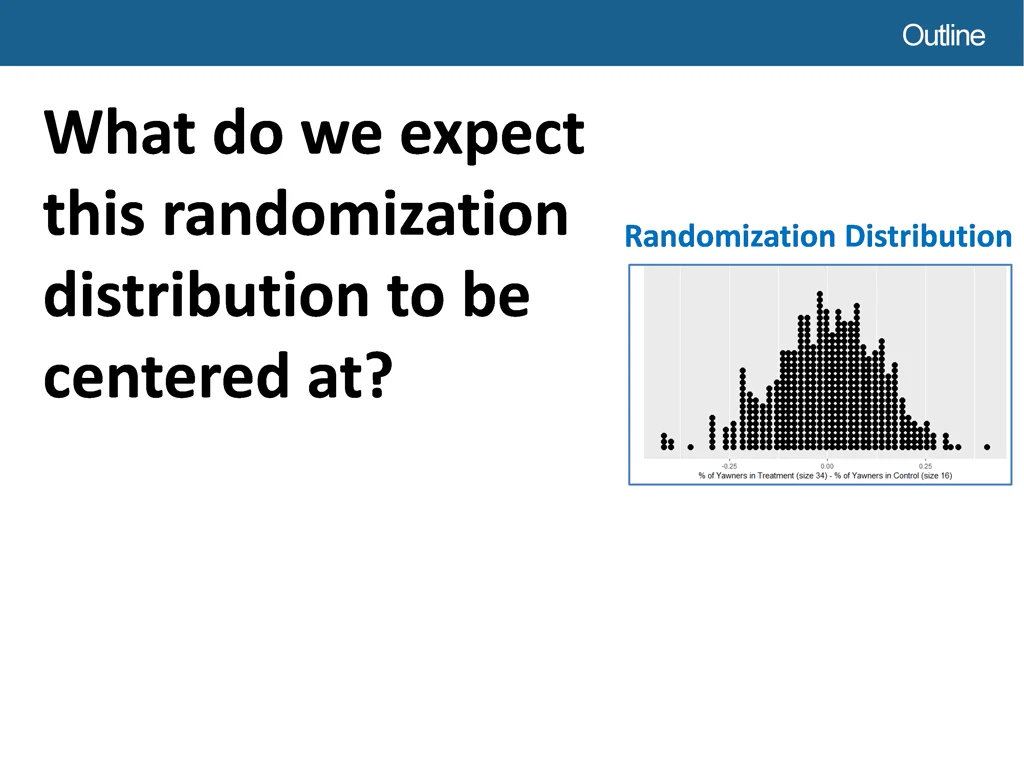
Outline What do we expect this randomization distribution to be centered at? Randomization Distribution 0

Outline 1. Housekeeping 2. Frequentist Inference via Randomization Testing A. Research Question: “Is yawning contagious?” 1. Set up competing claims. 1. 2. 2. Do our observed test results make us suspect the alternative hypothesis? 1. Find a distribution of sample statistics we might see if the null hypothesis was true. → create a randomization distribution. 2. Find the p-value: Using this distribution, find the probability/proportion of sample statistics that make us suspect the alternative hypothesis just as much or even more than the one we observed. 3. Make a conclusion: • P-value high: the sample statistic we observed was due to random chance and thus we don’t have sufficient evidence to suggest the alternative hypothesis OR • P-value low: the sample statistic we observed is “suspicious enough” to give us sufficient evidence to suggest the alternative hypothesis? B. Research Question: Does caffeine influence tapping rate? 3. Applicationexercise Null hypothesis – nothing’s going on Alternative hypothesis – research claim Randomization Testing: a type of Frequentist Inference
Outline Step 2: Find the p-value: Using this randomization distribution, find the probability/proportion of sample statistic differences that make us suspect the alternative hypothesis just as much or even more than the one we observed. Randomization Distribution 4%

Outline Inference: Randomization Distribution 500 total dots = 500 simulated % differences we would expect to see IF SEEING A YAWN AND YAWNING WERE INDEPENDENT. 199/500 ≈39.8% of simulated differences are 4% or above. 4%

Outline 1. Housekeeping 2. Frequentist Inference via Randomization Testing A. Research Question: “Is yawning contagious?” 1. Set up competing claims. 1. 2. 2. Do our observed test results make us suspect the alternative hypothesis? 1. Find a distribution of sample statistics we might see if the null hypothesis was true. → create a randomization distribution. 2. Find the p-value: Using this distribution, find the probability/proportion of sample statistics that make us suspect the alternative hypothesis just as much or even more than the one we observed. 3. Make a conclusion: • P-value high: the sample statistic we observed was due to random chance and thus we don’t have sufficient evidence to suggest the alternative hypothesis OR • P-value low: the sample statistic we observed is “suspicious enough” to give us sufficient evidence to suggest the alternative hypothesis? B. Research Question: Does caffeine influence tapping rate? 3. Applicationexercise Null hypothesis – nothing’s going on Alternative hypothesis – research claim Randomization Testing: a type of Frequentist Inference
Outline Inference: P-value Randomization Distribution 500 total dots = 500 simulated % differences we would expect to see IF SEEING A YAWN AND YAWNING WERE INDEPENDENT. 199/500 ≈0.398 of simulated differences are 4% or above. 4% P-value is High → There is NOT enough evidence to suggest yawning is contagious.

Outline 1. Housekeeping 2. Frequentist Inference via Randomization Testing A. Research Question: “Is yawning contagious?” 1. Set up competing claims. 1. 2. 2. Do our observed test results make us suspect the alternative hypothesis? 1. Find a distribution of sample statistics we might see if the null hypothesis was true. → create a randomization distribution. 2. Using this distribution, find the probability/proportion of sample statistics that make us suspect the alternative hypothesis just as much or even more than the one we observed (ie. the p-value) 3. Use this probability to determine if: • the sample statistic we observed was due to random chance and thus we don’t have sufficient evidence to suggest the alternative hypothesis OR • the sample statistic we observed is “suspicious enough” to give us sufficient evidence to suggest the alternative hypothesis? B. Research Question: Does caffeine influence tapping rate? 3. Applicationexercise Null hypothesis – nothing’s going on Alternative hypothesis – research claim

Outline Research Question: Does caffeine intake increase tapping rate?

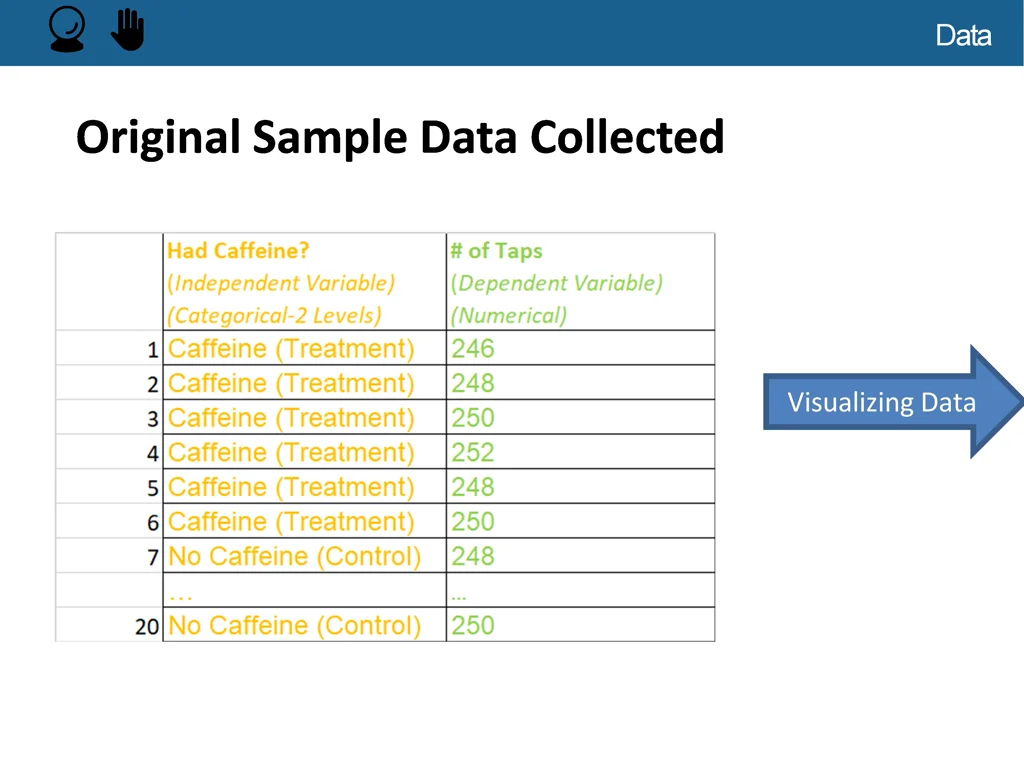
? ✋ Tapping oncaffeine ▶ In a double-blind experiment a sample of 20 male college students were randomly assigned to two groups of 10 students each. ▶ Each student drank the equivalent of about two cups of coffee, which included about 200 mg of caffeine for the students in one group, but was decaffeinated coffee for the second group. ▶ After a two hour period, each student was tested to measure finger tapping rate (taps per minute).

? ✋ Data Original Sample Data Collected Visualizing Data