Download
1 / 46
460 likes | 584 Views
Results from the 2013 Breeding Season for Lesser Prairie-Chickens in Kansas and Colorado. Red Hills (SC Kansas) ~ 40, 000 acres Mixed Grass Large pasture grasslands NW Kansas ~ 80,000 acres Short Grass Mosaic Colorado Sand Sage, Grassland, CRP, Ag, Cattle Short Grass ~ 50,000 acres.

E N D
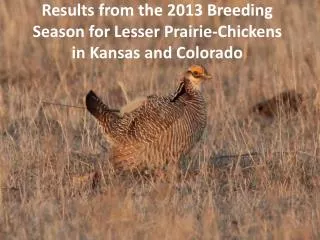
Results from the 2013 Breeding Season for Lesser Prairie-Chickens in Kansas and Colorado
Red Hills (SC Kansas) • ~ 40, 000 acres • Mixed Grass • Large pasture grasslands • NW Kansas • ~ 80,000 acres • Short Grass • Mosaic • Colorado • Sand Sage, Grassland, CRP, Ag, Cattle • Short Grass • ~ 50,000 acres
Methods • Capture • Lek sites • Fitted with VHF and GPS transmitters
Methods • Tracking • VHF: 4 times a week • Triangulation • SAT: ~8 GPS pts/day • Argos
Methods • Monitor females • Survival and location • Locate nests • Same location for 3+ days • VHF transmitters • GPS transmitters • Monitor nests • Radio telemetry • Monitor GPS locations • Remotely monitored • Monitored until hatched or failed
Methods • Vegetation measurements • Estimate % cover • Litter • Grass • Forbs • Bare ground • Shrubs • Visual obstruction reading (VOR) • Robel pole • Same measurements taken at paired random points
Results • April • Random movement pattern • May • Nest initiation • Centralization • June • Nest was depredated • 6 km move • 3 days • Localizes again 6 km
Results • Nest Depredation • Successful Nest Vs.
Results 11 km 15 km
Figure 2. Derived breeding season (Mar-Aug ,2013) survival estimates of female lesser prairie-chickens for each region studied. Figure 3. Female lesser prairie-chicken survival probabilities for three periods during the 2013 breeding season (Mar-Aug) in Kansas and E Colorado. Figure 4. 2013 breeding season (Mar-Aug) mortality distribution for female lesser prairie-chickens by week in NW Kansas. Figure 5. Derived breeding season (Mar-Aug, 2013) survival estimates for adult and juvenile female lesser prairie-chickens.
Results • 61 nests monitored • Red Hills — 20 • (8 successful) • Colorado — 4 • (1 successful) • Northwest — 37 • (6 successful) • 35 (57.4%) nests lost to predation • 6 renest attempts • 66.6% lost to predation
Results Daily Survival Rate Visual Obstruction (dm)
Results • Predictions • Greater VOR • Greater grass • Females selected for areas of greater visual obstruction • Mean VOR at nests = 1.33 dm • Mean VOR at paired points = 0.65 dm • p < 0.0001 • % Grass cover not selected at a significant level • p = 0.115 • % Bare ground was avoided • Mean % bare ground at nests= 4.06 • Mean % bare ground at paired points=14.0
Classify vegetative land cover type for LEPC range during 1950’s and 1960’s using aerial photography
Aerial Photography-Classification • Collect photos from period in 1950’s and 1960’s within range of LEPC • Mosaic photos using Agisoft • Georeference • Transportation shapefiles • “Head’s Up Digitizing” • Anderson 1 Classification Scheme • Agriculture • Rangeland • Urban/Built-Up • Water
Agisoft Mosaic 1 Photograph 327 Photographs Logan County, KS 1955
Study Objectives • Use occupancy models to quantify LEPC presence on CRP and native prairie habitat • Estimate population parameters in different landscapes
Forecasting • Can learn about causes of population change • Also forecast about the future of LEPC • Predict what might happen given climate change and changes in CRP
Surveys for LEPC • Surveys conducted twice from March 20 to April 20 since 1964 • Began with 3 routes, increased to 17 • Observer stops every 1.6 km and listens for booming males • Once the 16 km route is finished • Returns to identified leks, • Flushes and • Counts LEPC
Incorporating Covariates • Incorporate habitat designations from GIS and remote sensing work • Use climate indicies to account for changes in climate • Palmer Drought Severity Index • Spring and summer temperature
Expected Results • Estimates of occupancy and lek attendance • Quantify how changes to CRP affects chickens • Predict how changes in CRP will change lek abundance
Integrated Population Modeling • Integrated population modeling combines multiple sources of data to make inference • Count data • Harvest data • Banding data • Telemetry data • Data “talk” to each other to provide more precise estimates
Integrated Population Modeling • LEPC project has quite a bit of data • Nest success • Counts of leks • Radio and Satellite-telemetry • Combine information to make better inference
Integrated Population Modeling Immigration Nadults Nyoung Nest Success Fecundity Adult Survival Known Fate Habitat Data Lek Counts Habitat Data Habitat Data
Expected Results • Population estimates and growth rates for chickens utilizing different habitats • Predictions of how changes to habitat will affect abundance and growth rates
Future Directions • More data in coming years • Chick and brood survival • Population recruitment • Habitat selection and movements • Invertebrates • Patch relationships • Nests • Movements • Area • Water use • Fence impacts • Historical landscapes • Occupancy Analyses • Investigate differences in populations • Determine space use • Relate to landscape features • Frequency of habitat use • Movements between habitat patches • Duration of patch use • Patch size, shape, or juxtaposition • Anthropogenic impacts