Download
1 / 9
90 likes | 271 Views
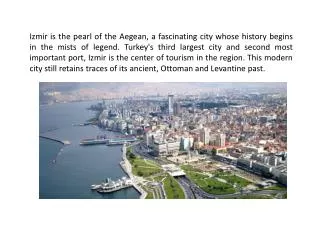
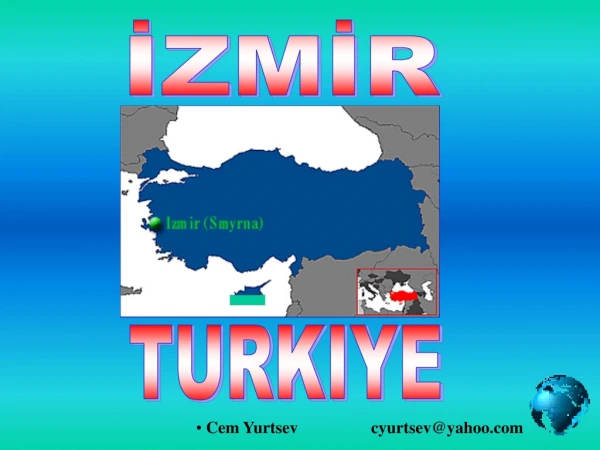
TELEMAC MODELING in the IZMIR BAY. by DEU-SUMER Water Resources Management Research and Application Center Izmir, Turkey. TRANSFER OF GEOSPATIAL DATA. Geospatial Base Data Water Depths Isolines Sea-Land Border Derived DEM. Geospatial Data transferred into SX file format.

E N D
TELEMAC MODELINGin the IZMIR BAY by DEU-SUMER Water Resources Management Research and Application Center Izmir, Turkey
TRANSFER OF GEOSPATIAL DATA • Geospatial Base Data • Water Depths • Isolines • Sea-Land Border • Derived DEM Geospatial Data transferred into SX file format
GENERATION OF ELEVATION MODEL (MESH) DEM Mesh with boundaries Mesh
REGENERATING THE MESH FOR EASY COMPUTING Based on bathimetry Considering a derived criterion Number of Nodes 25,292 nodes 4701 nodes
BOUNDARIES OF THE CONTROL VOLUME/AREA Boundaries: Deep Sea (liquid boundary) River Outlet (liquid boundary) Coastline & islands (solid boundaries) Deep Sea (Aegean Sea) Gediz River Outlet
CALIBRATION DATA SET (EXAMPLES) Control Point 1: Long: 26.78 Lat: 38.57 X: 480835 Y: 4269080 (UTM-35) For the period of 23-30.09.1994 At 10m. depth Max. Velocity : 10.50 cm/sec Avg. Velocity : 3.93 cm/sec (0.0393m/sec) At 25m. Depth Max. Velocity : 9.60 cm/sec Avg. Velocity : 3.55 cm/sec (0.0355m/sec) Average ~0.2m/sec Output to Excel in .num format
CALIBRATION DATA SET (EXAMPLES) Control Point 2: Long: 26.68 Lat: 38.52 X: 472104 Y: 4263560 (UTM-35) For the period of 23-30.09.1994 At 10m. depth Max. Velocity : 11.40 cm/sec Avg. Velocity : 6.30 cm/sec (0.060m/sec) At 25m. Depth Max. Velocity : 12.20 cm/sec Avg. Velocity : 4.86 cm/sec (0.0486m/sec) Average ~0.09m/sec Output to Excel in .num format
CALIBRATION DATA SET Control Points (More): Long: 26.8490 Lat: 38.3980 For the period of 12.08.1997-23.09.1997 Long: 26.9235 Lat: 38.3952 For the period of 12.08.1997-23.09.1997 Long: 26.8467 Lat: 38.3983 For the period of 06.11.1997-20.01.1998 … Varying positions Varying times Calibration is still in progress due to: Model simulation time step is 2 secs. BUT the calibration data is composed of averages from A NUMBER OF days. In such a case, total simulation time for a single trial becomes more than 5 hours and makes the calibration process slower!!!
WHAT IS NEXT? Calibration of the TELEMAC model is going to be completed soon so that the model becomes representative for the water motion within the bay. Following the completion of the TELEMAC modeling, Water Quality Modeling is going to be performed on SUBIEF. In SUBIEF, there will be a number of scenario tests by changing the dominant wind direction and the average pollutant loads coming both from the Gediz and other point sources in the inner bay. The results will be evaluated by using the computer program developed by Yvon in order to determine the critical areas in the bay considering the pollution transport. As the time is limited for the rest of the work, all efforts will be in a continuous contact with SOGREAH Report Writing…to be completed partly after Telemac2d modeling.