Maximizing Retail Performance: Insights from SEC Filings and Sales Growth Strategies
270 likes | 380 Views
This document serves as a guide for retail analysts aiming to enhance their understanding of financial performance metrics within the retail sector. It covers essential strategic components including the analysis of gross margin, inventory turnover, and asset performance metrics drawn from publicly traded retailers. By examining SEC filings and utilizing tools like Chain Store Age and internet sales growth, analysts can formulate strategic recommendations for increasing store numbers, optimizing merchandise mixes, and understanding the impact of competitive dynamics on financial outcomes.

Maximizing Retail Performance: Insights from SEC Filings and Sales Growth Strategies
E N D
Presentation Transcript
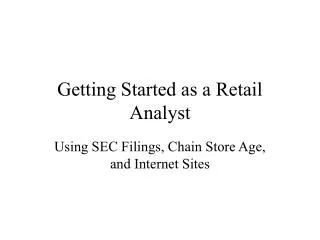
Getting Started as a Retail Analyst Using SEC Filings, Chain Store Age, and Internet Sites
Growth in Sales for Chain Retailers • Increasing the number of stores • Adding a new store format • Increased sales promotion • Changing the merchandise mix
Exam Data III • Select three publicly traded retailers, which compete within an overlapping merchandise line. • Prepare an exhibit (table) tracking their performance on 5 components of the Strategic Profit Model and • Gross Margin (or gross profit if shown), turnover, and GMROI. • Optional: Accounts payable and selling space (GMROS) • Select a consecutive span of years including the most recent (2005) and 2002.
EDGAR • “Search the EDGAR Database” • “Companies and other filers”
Gross Margin • Sales revenue minus cost of goods sold • Selling price*quantity - cost*quantity • Percent gross margin=gross margin/revenue
Turnover • “True” measures of turnover
GMROI • “Gross margin return on inventory”
Days Payable • Indication of how long a firms taking (on average) to pay bills, or comparison of how it’s using suppliers to finance inventory.
Gross margin • Three components: • Reflects the service outputs provided by an institution to its buyers • Risk • Perishability • Pre-sold, bespoke • Brand strength • Competition • Different from initial markup, closer to maintained markup
Factors Affecting Gross Margin • Competition: Higher the competition—the lower gross margins, more intensely distributed brands have low margins. • Differentiated merchandise • Risk of the merchandise: Higher risk, higher markups… (and greater markdowns)
In-store allocation of resources among lines • Ratio analysis: • GMROI = gross margin/inventory • GMROS = gross margin/selling space • GMROL = gross margin/employee unit • These decisions are set with regard to the design of the format, and modifications to the format must address these criteria
Inventory Performance • Assets turnover = Net sales / total assets • Inventory turnover = Units sold / units in inventory Cost of goods sold / average inventory Sales / inventory @ retail • Return on assets = Net profit / total assets Net profit margin x assets turnover
Gross Margin=10.7% (47,145M-42,092M) 47,145 Profit Margin 1.8% COSTCO 2004 Turnover=11.5 (42,092M) 3,644M Return on Assets =5.616% Asset Turnover=3.12 47,145/15,092 Return on Net Worth = 11.11% Financial Leverage 15,092/7,625
Gross Margin=33.0% (10,282M-6,887M) 10,282M KOHLS 04 Profit Margin 5.7% Turnover=4.28 (6,887M) 1,607M Return on Assets =8.75% Asset Turnover=1.54 10,282/6,698 Return on Net Worth = 13.98% Financial Leverage=1.60 6,698/4,191
KOHL’S CORP '99 Profit margin 5.66% 258,142 4,557,112 Return on assets 8.86% 258,142 2,914,662 Asset turnover Return on 1.56X net worth 4,557,112 15.32% 2,914,662 258,142 1,685,503 Leverage 1.73X 2,914,662 1,685,503
Leverage: Total Assets/Net Worth • Ratio illustrating the use of debt by the retailer. • Provides a measure of market assessment of the risk of the operation, the higher the proportion of apparel in inventory, the lower ratio of financial leverage. • ROA x Leverage = Return on Net Worth
Hastings 2005 Profit margin 1.07% 5,809 542,016 Return on assets 2.28% 5,809 254,116 Asset turnover 2.13X Return on net worth 542,016 6.45% 254,116 5,809 89,774 Leverage 2.83x 254,116 89,774
KOHL’S CORP '99 Profit margin 5.66% 258,142 4,557,112 Return on assets 8.86% 258,142 2,914,662 Asset turnover Return on 1.56X net worth 4,557,112 15.32% 2,914,662 258,142 1,685,503 Leverage 1.73X 2,914,662 1,685,503
Routes to higher financial performance:Increasing the Profit Margin • Increasing the Gross Margin • Smarter purchasing: fewer discounts and reductions • Differentiating the merchandise reduces price competition • Vendor discounts/concessions • Reducing Expenses • "Flexible" employee scheduling • Incorporating a commission portion into compensation • Reducing store hours during slack periods • Shifting functions to suppliers
Routes to higher financial performance:Increasing the Asset Turnover • Increasing Sales: • "High velocity retailing," lower margins • Reducing Investments in Assets • Lower investments in inventory, supplier retains title to some goods. • Lease rather than own, such as build the store, sell it, and lease it back from owners. • Minimize investments in practices not core to operations, such as distribution. • Distribute retained earnings ("cash") to owners in form of dividends. • In short, reduce investment in assets that come at the expense of investments in inventory.
Routes to higher financial performance: Increasing Financial Leverage • Expand assets through the use of debt rather than equity instruments for inventory: • Increase accounts payable • Increase use of notes payable • Use debt financing for investment in real estate. • Utilize debt financing to the point where increased interest expenses hurt return on net worth.