Download
1 / 12
120 likes | 265 Views
Class Project Report, Spring 2014 E 449/549 Sustainable Air Quality. Sustainability Transition of Sulfurous Air Quality 1960- 2013 Emissions and Causality Drivers - Lesley Olson Ambient Sulfurous Air Quality - Andrew Martahus Control Measures - Jennifer Elwell

E N D
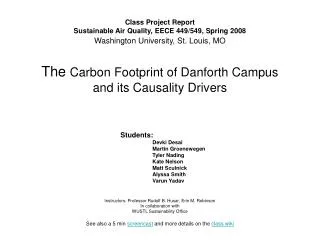
Class Project Report, Spring 2014E 449/549 Sustainable Air Quality Sustainability Transition of Sulfurous Air Quality 1960-2013 Emissions and Causality Drivers - Lesley Olson Ambient Sulfurous Air Quality - Andrew Martahus Control Measures - Jennifer Elwell Instructor: Rudolf B. Husar Washington University, St. Louis, MO, May 2, 2014
Traditional views of Sustainable Development • Brundtland Commission (1987) • Meet the needs of the present without compromising the ability of future generations to meet their own needs • National Academy of Sciences • Our Common Journey: A Transition Towards Sustainability • Call for evaluation of major trends and transitions needed to determine what issues must be tackled
Sustainability Science Harvard Sustainability Science Program • Defining human well being as a goal inter and intra generationally • Assets, institutions and knowledge • Methodology change from NAS mode • Research defined explicitly by a practical issue, not the other way around • Linking knowledge with action for an adaptive management control mechanism
Traditional Linear Causality Model (SOxEmmision Drivers) Population P Economy GDP$/yr Energy Use Btu/yr Fuel Cons. T/yr SOX Emiss. T/yr Per Cap. Econ. (GDP/P) Energy Efficiency (Btu/GDP) Fuel Eny. Factor (T/Btu) Emissions Factor (T/T)
Using New Technology to Increase Transparency and Improve Environmental Regulation Introduction of an Emission Trading System (ETS) in 3 of the most polluted industrial areas in India. PM CEM devices will be installed and correlated, collect PM emission data from specific sources. This data will then be published periodically and be made available to the public to ensure transparency. With accurate and transparent measurements, a market efficient ETS will then be developed creating a more efficient and regulated system. Fuel Cons. T/yr SOX Emiss. T/yr Population P Economy GDP$/yr Energy Use Btu/yr Per Cap. Econ. (GDP/P) Energy Efficiency (Btu/GDP) Fuel Eny. Factor (T/Btu) Emissions Factor (T/T) Action: Transparent market-based ETS Monitoring: CEMs installation/emissions measurement and reporting
Is There an Energy Efficiency Gap? Measuring Returns to Efficiency with a Field Experiment in India Government and private consultancy partnerships to promote investment in improved industrial energy efficiency. The costs and returns of investments are measured to determine if there is a win-win scenario for the environment and industry – where efficiency improvements pay off and cost industry less in the long run. Use of energy manger specialists to suggest improvements and determine the best methods for adaptation through field testing. Fuel Cons. T/yr SOX Emiss. T/yr Population P Economy GDP$/yr Energy Use Btu/yr Per Cap. Econ. (GDP/P) Energy Efficiency (Btu/GDP) Fuel Eny. Factor (T/Btu) Emissions Factor (T/T) Monitoring: Energy Efficiency Audit Action: Implementation Of Efficient Practices
Improving Household Efficiency through Information and Incentives Arm homeowners with the information necessary to make them aware of their energy consumption. Tactics used to incentivize individuals to use less energy on a household day-to-day basis. Curb the increasing residential energy use that is coming in India with increased wealth and westernized lifestyles. Awareness, competition and rewards for favorable behavior are consistently found to be powerful human motivators and as a result, these are going to be provided in the form of comparative energy use report cards for households. Residential energy use should decrease while cultural awareness and general energy saving practices should increase. Fuel Cons. T/yr SOX Emiss. T/yr Population P Economy GDP$/yr Energy Use Btu/yr Per Cap. Econ. (GDP/P) Energy Efficiency (Btu/GDP) Fuel Eny. Factor (T/Btu) Emissions Factor (T/T) Action: Distribution of Info and Incentives Monitoring of Household Energy Use
Can Regulation Reduce Household use of Polluting Fuels? Decreasing the use of fuels in rural areas that contribute greatly to indoor air pollution issues, particularly biomass burning. Making light petroleum gas (LPG) and stoves more accessible and affordable for a greater number of households. Regulatory practices to alleviate the supply-side barrier to the adoption of modern fuel sources. Study in household decision making in order to determine the real demand for the fuel. Decreased use of dirtier burning fuels, source emissions will decrease and a fuel with a more favorable environmental factor will be used therefore decreasing indoor air pollution Fuel Cons. T/yr SOX Emiss. T/yr Population P Economy GDP$/yr Energy Use Btu/yr Per Cap. Econ. (GDP/P) Energy Efficiency (Btu/GDP) Fuel Eny. Factor (T/Btu) Emissions Factor (T/T) Increased distribution and availability of LPG Development of Efficient Reg. Practices
The Need for Control Measures • Human health effects • Acute and chronic lung infections, disease and cancer; asthma; heart disease • Reduced life span • Ecosystem damage • Acid rain • Corrosion • Weather and climate - threats on human life • Psychological effects • Esthetic effects • Economic effects • Damage to agriculture • Reduced tourism