Download
1 / 59
590 likes | 990 Views
The WBCSD Sustainable Mobility Project – A Status Report Presentation by George C. Eads Charles River Associates, Inc. Project Lead Consultant August 8, 2002 Project Sponsors Structure of the WBCSD Sustainable Mobility Project

E N D
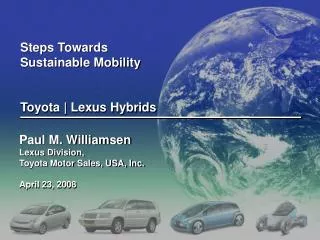
The WBCSD Sustainable Mobility Project – A Status ReportPresentation by George C. EadsCharles River Associates, Inc.Project Lead ConsultantAugust 8, 2002
Structure of the WBCSD Sustainable Mobility Project • Part 1 – Survey of the state of world mobility and its sustainability at the end of the twentieth century • Part 2 – Development of vision(s) of how mobility can be made sustainable in the future and of strategies for the attainment of this (these) vision(s)
Structure of the WBCSD Sustainable Mobility Project • Phase 1 – Survey of the state of world mobility and its sustainability at the end of the twentieth century – Mobility 2001, released October 2001 • Phase 2 – Development of vision of how mobility can be made sustainable in the future and of strategies for the attainment of this vision
Structure of the WBCSD Sustainable Mobility Project • Phase 1 – Survey of the state of world mobility and its sustainability at the end of the twentieth century – Mobility 2001, released October 2001 • Phase 2 – Development of vision of how mobility can be made sustainable in the future and of strategies for the attainment of this vision– now underway; Sustainable Mobility 2030 to be completed by December 2003
Outline of today’s presentation • Summary of Mobility 2001 • Scope of report • Major influences on the sustainability of mobility • Sustainability “scorecards” for the developed and developing worlds • “Grand challenges” to achieving sustainable mobility • Description of work underway in Part 2 • Additional details on fuels-related work
Scope of Mobility 2001 • Addresses multiple dimensions of sustainability • Focuses on urbanized areas of both the developed and developing worlds • Includes all transportation modes • Includes freight mobility as well as personal mobility
Study team • MIT academic departments and research units represented: • Center for Transportation Studies • Energy Laboratory • Materials Systems Laboratory • Department of Urban Studies and Design • Sloan Automotive Laboratory • Department of Mechanical Engineering • Laboratory for Energy and the Environment • Department of Civil and Environmental Engineering • Center for Technology Policy and Industrial Development • Department of Aeronautics and Astronautics • CRA representation: • Senior research staff of CRA’s Transportation Practice
Major influences on the sustainability of worldwide mobility • Evolving patterns of human settlement and economic activity • Dominant role played by the personal road vehicle in providing personal mobility in the developed world • Certain regularities in personal travel patterns • Enormous growth in freight transportation • Transport’s almost total dependence on petroleum-based fuels • CO2 and “conventional” emissions from transport • Rapid urbanization and motorization of urbanized areas in the developing world
Evolving patterns of human settlement and economic activity Two phenomena are shaping this evolution • Urbanization – “the most powerful anthropogenic force on earth” • “Suburbanization” -- reduction in population density of urbanized areas Neither could be occurring to the extent they are without the mobility improvements of the post WWII era Both have important implications for the sustainability of mobility
Population living in urban areas – 1950, 1975, 2000, and 2030(p) 1950Total pop. 2.5 billion 30% urban 1975Total pop. 4.1 billion 38% urban 2000Total pop. 6.1 billion 47% urban 2030Total pop. 8.1 billion 60% urban 0.20 0.28 0.31 1.01 0.90 0.30 0.37 0.81 1.94 0.73 3.88 0.45 1.41 3.02 2.22 2.93 Urban developed Rural developed Urban developing Rural developing Source: UN (1999).
Urban population densities are falling Data for illustrative developed world urban areas Data are for “urbanized area” as defined by local and/or national authorities Source: Demographia (2001).
Note: Data not available for Iceland, Ireland, Luxemburg, and New Zealand. Source: Updated database, based on Schafer (1998). II. Auto* ownership has been rising throughout most of the developed world *Vehicle ownership per 1000 population *Auto = all light-duty, personal use vehicles
Annual auto passenger-km/person Note: Data not available for Canada, Iceland, Ireland, Luxemburg, and New Zealand.Source: Updated database, based on Schafer (1998). So has the utilization of autos* *Autos = all personal use light duty vehicles
Passenger - km/person/year 18,000 18,000 18,000 Rail+Tram Rail+Tram Rail+Tram 16,000 16,000 16,000 Bus Bus Bus 14,000 14,000 14,000 Car Car Car 12,000 12,000 12,000 10,000 10,000 10,000 8,000 8,000 8,000 6,000 6,000 6,000 4,000 4,000 4,000 2,000 2,000 2,000 0 0 0 Amsterdam Amsterdam Amsterdam Copenhagen Copenhagen Copenhagen Frankfurt Frankfurt Frankfurt London London London New York New York New York San Francisco San Francisco San Francisco Vienna Vienna Vienna Zurich Zurich Zurich Brisbane Brisbane Brisbane Brisbane Paris Paris Paris Paris Hamburg Hamburg Hamburg Hamburg Melbourne Melbourne Melbourne Melbourne Tokyo Tokyo Tokyo Tokyo Washington, DC Washington, DC Washington, DC Washington, DC Detroit Detroit Detroit Detroit Source: Source: Source: Source: Kenworthy Kenworthy Kenworthy Kenworthy and and and and Laube Laube Laube Laube (1999). (1999). (1999). (1999). The auto now dominates personal travel in most developed-world urbanized areas Passenger Passenger - - km/person/year km/person/year
90% 90% 90% 80% 80% 80% 1960 1960 1960 70% 70% 70% 1990 1990 1990 60% 60% 60% 50% 50% 50% 40% 40% 40% 30% 30% 30% 20% 20% 20% 10% 10% 10% 0% 0% 0% Amsterdam Amsterdam Amsterdam Copenhagen Copenhagen Copenhagen Frankfurt Frankfurt Frankfurt London London London New York New York New York San San San Vienna Vienna Vienna Zurich Zurich Zurich Francisco Francisco Francisco Washington, DC Washington, DC Washington, DC Paris Paris Paris Brisbane Brisbane Brisbane Detroit Detroit Detroit Hamburg Hamburg Hamburg Melbourne Melbourne Melbourne Tokyo Tokyo Tokyo Public transport share has been declining Public transport share of motorized passenger kilometers Source: Kenworthy and Laube (1999)
Share of intercity passenger-kilometers; Britain (1990) and the Netherlands (1990) Netherlands Britain Car54% Air29% Air36% Car58% Busand Rail13% Rail7% Bus3% Source: Updated database based on Schafer (2000); calculations by study team. The auto also dominates long-distance travel in the developed world
Regularities in personal travel across different countries and times
Commuting data for US – 1990 and 2000 Source: US Census
Growth in freight transportation – all modes except ocean freight Worldwide tonne-kilometers, 1970-1994; All modes except ocean freight
Growth in ocean freight Worldwide tonne-kilometers, 1975-1995; Ocean freight New Mode 2.0 Note: Red numbers show total freight movements except for ocean freight
Road freight has been growing everywhere Tonnage figures understate value of freight hauled by road
Rail freight traffic growing in a few regions Tonnage figures overstate value of freight hauled by rail
V. Transportation’s almost total dependence on petroleum-based fuels • 96% of fuel used in transportation is petroleum-based (gasoline, diesel, residual fuel oil, jet fuel) • Transport uses just over half of all petroleum • Presently, two-thirds of transport fuel is used in industrialized countries, but industrializing country use is climbing fast; by 2020, projected to be almost equal
Commercial and other6% Residential8% Production of Energy41% Transport26% Manufacturing andConstruction19% Source: IEA 2000a. VI. Emissions from transportation – CO2 Share of worldwide C02 emissions from the combustion of fuel, by sector -- 1998 Of which: Road (passenger and freight) = 16.9% Rail, domestic air, and inland waterway = 6.1% International air = 1.4% International water = 1.7%
Emissions of “conventional” pollutants Transport and road vehicles as a share of total emissions of pollutant (%) Source: US Data – Transportation Energy Data Book, Edition 21 – 2001 EU 15 Data – ACEA, “Commentary on the TERM 2001 Report”
VII. The rapid urbanization and motorization of the developing* world The twin forces of urbanization and motorization are threatening to overwhelm whatever improvements in mobility that citizens in a number of developing countries have begun to enjoy in recent decades * includes “emerging” economies of Eastern Europe
As incomes have risen, vehicle ownership rates in some developing world countries have begun to approach Western European and Japanese rates of 30-40 years ago Vehicle ownership per 1000 population Source: Ward’s/Pemberton, World Vehicle Forecasts and Strategies: The Next 20 Years, 1996.
80 80 Walking Walking Auto Auto Public transport Public transport 60 60 40 40 20 20 0 0 Lower income groups in developing world countries are heavily dependant on public transport Data for Santiago Percentage of all trips Percentage of all trips <$117 <$117 $208 $208 – – $316 $316 $1,160 $1,160 – – $2,865 $2,865 $494 $494 – – $750 $750 $117 $117 – – $208 $208 $316 $316 – – $494 $494 $750 $750 – – $1,160 $1,160 >$2,865 >$2,865 Monthly income (1991 US$) Monthly income (1991 US$) Note: Santiago does not add to 100%; not all modal shares include Note: Santiago does not add to 100%; not all modal shares includ ed. ed.
Traffic fatalities and serious injuries are an especially serious problem
Accidents victims aren’t just vehicle occupants - Mode share and road accidents in Delhi, 1994 Mode Share Fatalities Ratio (fatalities/ Mode (%) (%) mode share) Car/taxi 5 2 0.6 Bus 42 10 0.2 Motorized 2 - wheelers 12 27 2.3 Bicycle 5 14 2.8 Pedestrian 32 42 1.3 Source: Mohan and Tiwari (1999).
Table 4 - 8. Motor vehicle contribution of total air pollutants in selected developing - country cities City Year CO HC No SO SPM x 2 Beijing 1989 39 75 46 NA NA 2000 84 NA 73 NA NA Bombay 1992 NA NA 52 5 24 Budapest 1987 81 75 57 12 NA Cochin, India 1993 70 95 77 NA NA Delhi 1987 90 85 59 13 37 Lagos, Nigeria 1988 91 20 62 27 69 Mexico City 1990 97 53 75 22 35 1996 99 33 77 21 26* Santiago 1993 95 69 85 14 1997 92 46† 71 Motor vehicle-related air pollution an especially serious problem in many urban areas 11 15 86‡ São Paulo 1990 94 89 92 64 39 Sources: WRI (1996); West et al. (2000); CONAMA (1998); Fu and Yuan (2001) . * PM10. † Does not include evaporative emissions from refueling. ‡ PM10, includes fugitive road dust. NA: Data not a vailable
What are the implications? Mobility 2001’s sustainability “scorecards”
Level Direction Measuresto be increased + Access to means of personal mobility – Equity in access – Appropriate mobility infrastructure + Inexpensive freight transportation Measures to be reduced – Congestion + “Conventional” emissions – Greenhouse gas emissions + Transportation noise Other environmental impacts Developed world – – Disruption of communities + Transportation - related accidents + Transportations' demand for nonrenewable e nergy + Transportation - related solid waste
Level Direction Measures to be increased + Access to means of mobility ? Equity of access – Appropriate mobility infrastructure + Inexpensive freight transportation Measures to be reduced – Congestion – “Conventional” emissions – Greenhouse gas emissions – Transportation noise Other environmental impacts Developing world – – Disruption of communities – Transportation - related accidents + Transportations’ demand for non - renewable energy ? Transportation - related solid waste
Group 1 • Adapting the personal use motor vehicle to the future accessibility needs/requirements of the developed and developing worlds • Drastically reducing carbon emissions from the transportation sector • Providing mobility for those not having access to personal motor vehicles in both the developed and developing worlds
Group 2 • Resolving the competition for access to infrastructure between personal and freight transportation • Dealing with growing problem of congestion in inter-city personal and goods transportation
Group 3 • “Reinventing” the process of planning, developing, financing, and managing mobility infrastructure • Improving institutional capability to identify, build consensus about how to solve, and implement approaches that promote sustainable mobility And, while doing all of this: • Ensuring that our transportation systems continue to play their essential role in economic development and, through the mobility they provide, serve essential human need and enhance the quality of life
From Mobility 2001 to Mobility 2030 • Mobility 2001 provides us with a “situation analysis” • How do we now develop a “vision of sustainable mobility” and “pathways” for reaching it?
Developing Mobility 2030 • Work has been divided into ten separate tasks, or “work streams” • Purpose of each work stream – to provide a major piece of the information and analysis
Work Stream #1 -- Indicators • “We will agree upon a set of sustainability indicators that will enable the project to develop an operational definition of sustainable mobility.” Action team being chaired by Norsk Hydro; recommendations presented to Working Group in mid-July meeting
Why indicators? • To permit individual action teams to know how the information they are producing will be used; • To permit the project as a whole to assure that it is focusing on the most relevant issues; • To permit those involved in the later work streams to measure the impact of potential actions; and, • To assure that our “vision” is grounded in reality and addresses the major challenges to achieving sustainable mobility.
Work stream #2 – transport vehicle design and technology “We will assess the potential impact on sustainability of mobility of developments in transport vehicle technology and design” Action Team being chaired by VW; preliminary report to be presented to Working Group in September
Range of transport vehicles • Passenger vehicles • 1-2 passenger (including mopeds, etc.) • 3-6 passenger (“conventional” cars) • 6-15 passenger (small vans, etc.) • buses (city, suburban, intercity) • Goods-hauling vehicles • Light, local use • Medium, local use • Heavy, local use • Medium, intercity use • Heavy, intercity use • Multi-purpose vehicles • Purpose-built vans • Car-derived vans • Vans derived from pickups or similar vehicles Information to cover both developed and developing worlds
Range of performance attributes • Powertrain types, their fuel requirements, and their performance characteristics • Materials used in vehicle construction • Safety performance • Occupant protection • Crash avoidance • Interaction with pedestrians, etc. • Emissions performance • Conventional • Greenhouse gas • Recyclability • Potential for use of on-board electronics
Work stream #3 – transport fuels • “We will identify the potential impact on sustainability of fuels used in transportation • Objectives: • Develop a shared understanding of fuel pathways which can contribute to sustainability goals by 2030 • Identify enablers and blockers for each pathway • Ensure that regional differences are taken into account, ensure adequate focus on developing world issues.” Action team being chaired by Shell and Toyota
Work stream #4 – infrastructure • “We will assess the infrastructure requirements resulting from the developments in transport technology and design and by the impact of the changes in fuels used by transport analyzed in Work Streams 2 and 3. We also will assess the potential impact on sustainable mobility of addressing – and of failing to address – these and other infrastructure requirements.” Action team being chaired by GM
Work stream #5 – demand for personal mobility • “We will assess the impact on the demand for personal mobility of (a) the developments identified in transport vehicle design and technology, fuels used in transport, and associated transport infrastructure requirements, and (b) expected developments in population, urban form, growth in per capita income, changes in income distribution, etc.” Action team being chaired by Ford and Honda
Work stream #6 – goods and services mobility • “We will assess the impact on the demand for goods and services mobility of (a) the developments we have identified in transport vehicle design and technology, fuels, and infrastructure, and (b) expected developments in population, urban form, growth in per capita income, changes in the composition and structure of industry, changes in logistics requirements, etc.” Action team being chaired by DaimlerChrysler