Download
1 / 11
110 likes | 220 Views
Std MCC9-12.S.ID4 Types of sampling methods. The mean score of the ACT test takers at OLA High is 1450 and the standard deviation is 20. Carl scored 1.34 Standard deviations below the mean. a) What is his z score? What is his actual ACT score ?

E N D
Std MCC9-12.S.ID4 Types of sampling methods
The mean score of the ACT test takers at OLA High is 1450 and the standard deviation is 20. Carl scored 1.34 Standard deviations below the mean. a) What is his z score? What is his actual ACT score ? c) What percentile of students scored less than Carl ? d) What percent of students scored greater than Carl? 2. TELL A NEIGHBOR- Explain a) Simple Random Sampling b) Strategic Sampling c) Systematic Sampling d) Cluster Sampling e)Strata f)Convenience Sampling g) Volunteer Response Sampling
The mean score of the ACT test takers at OLA High is 1460and the standard deviation is 20. Carl scored 1.8 Standard deviations above the mean. a) What is his z score? What is his actual ACT score ? c) What percentile OF STUDENTS scored less than Carl ? What percent of students scored greater than Carl? Pat’s score was 1520- what is Pat’s z score? What is the probability of students scoring between Pat and Carl’s ACT SCORE? Sampling e)Strata f)Convenience Sampling g) Volunteer Response Sampling
When gathering/producing data, there are special considerations: Population: The large group that is being studied Sample: A subgroup from which the data will actually be collected Members of a sample are called individuals (people, animals, objects…) Any characteristic of the individual is called a variable (age, height, favorite color)
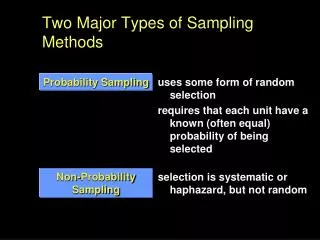
Sampling methods are important to ensure the conclusions can be extended to the entire population. Voluntary Response Sample Individuals choose to participate in the study as a response to a general appeal (Ex: call in polling) Convenience Sample Individuals chosen to participate in the study are easy to access (Ex: interviews at a mall) Both of these methods could create biased results (ie: consistently over or under estimates the results) BIASisBAD!
BIASED AND UNBIASED BIASED UNBIASED • Are you going to eat all that greasy food before the race? • You are not giving that jerk another chance, are you? • Choose the first math class on B hall to represent the school. • Interview the first 10 people who attended the concert
The best way to choose the sample for a study or experiment is by a Simple Random Sample (SRS). This means a set of individuals are chosen in a way so that every individuals (or set of individuals) in the population had an equal chance to be selected. What are ways to do a Simple Random Sample so that everyone/everything in the population has a chance to be part of the sample? Example:1. Everyone in the classroom has a number 2. All the numbers are put into a box. 3. Numbers are drawn from the box.
Other Types of Random Samples Stratified Random Sample: - population is divided into groups of individuals that have an important similarity (called strata) - Equal number of individuals are chosen from each strata to create the sample
Cluster Sample: - use population with natural groups or clusters - some of the clusters are randomly selected to create the sample- sample is whole cluster
SYSTEMATIC SAMPLING 1’Each member of the population is given a Number. 2. A starting point is chosen randomly. 3.A sampling pattern is established to choose samples . Ex. Every 4 th person.
To collect data that is not biased, choose your sample for the study carefully. If a study is done with faulty data, the results and any conclusions are questionable.