Download
1 / 14
150 likes | 383 Views
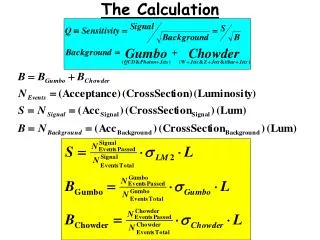
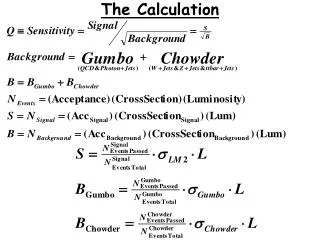
WLTP. Further modifications on the gearshift calculation tool. Heinz Steven 09.03.2013. 1. Background.

E N D
WLTP Further modifications on the gearshift calculation tool Heinz Steven 09.03.2013 1
Background • In order to take into account the technical progress and the increased variety of transmission design (e.g. 4-speed up to 7-speed gearboxes) shift points at fixed vehicle speeds are no longer appropriate. • In order to reflect practical use as well as fuel efficient driving behaviour as much as possible, the prescriptions are based on the balance between the power required for driving resistance and acceleration and the power provided by the engine in all possible gears at a specific cycle phase. • In order to cover the wide range of rated engine speeds (e.g. 3200 to 8000 min-1) depending of the engine technology, a calculation tool was developed which is based on normalised engine speeds (normalised to the span between idling speed and rated engine speed) and normalised full load power curves (normalised to rated power) versus normalised engine speed. 2
Modificationsperformedduringvalidation 2 • This calculation tool was used during validation 2 of the WLTP project. • Some comments were already made within the validation 2 time period and led to the following modifications for the 2. version of the tool in conjunction with the implementation of the modified cycle versions for low powered vehicles: • options for the choice of lower n_min_drive values (for gears >= 3) for sensitivity studies but not for validation 2, • n_min_2 was added as input parameter. n_min_2 is the minimum engine speed in gear 2. n_min_2 was defined as 1,25*idling_speed. • It is now recommended to set n_min_2 to 1,15*idling_speed. The minimum value that can be used for the calculation is 1,1*idling_speed. 4
Modificationsperformedduringvalidation 2 • The safety margin accounting for the difference between stationary wot power curve and the power available during transient conditions could be chosen as input parameter in the 1. version. • The choice of 90% was recommended. The safety margin was then set to 90% and cannot be changed any more in the 2. version. 5
Summary of discussionpoints • The comments after validation 2 can be summarised as follows: • Input data: • Default values for the full load power curve and for driving resistance coefficients should not be provided in a final version. • The safety margin for the full load power curve needs to be updated/improved, the input data for the curve need to be simplified. • Uniform input data for a vehicle family. 6
Summary of discussionpoints • Downshifts: • Downshift to 1. gear: Althoughthe number of downshifts to the 1. gearwithin a shorttripwerereducedwithversion 2 compared to version 1, thereis still a need for furtherimprovement. • Downshifts by morethan 2 gears. • Approach • The currentapproachaimes at a compromisebetweeneconomicdriving and representativitywithrespect to in-use data, • The current n_min_drive conceptis a bitmorefavourable for Diesel enginescompared to Petrol engines. 7
Summary of discussionpoints • As a consequence the number of shift points is higher compared to a vehicle speed based system. • It should be assessed, how the number of shift points correlates with the in-use data and whether or to what extent it could be reduced by an increase of engine speeds. 8
Modifications made for the 3. version • For the 3. version of the calculationtool, whichis not yet distributed, the followingmodificationswere made: • An additional safetymargincan be applied on the wot power curve, additional to the 10% default margin. • The additional safety margin is fully applied at idling speed and then linearily reduced to 0 at rated speed. • As an example, if one chooses 10% for the additional margin, the effective safety margin at idling speed is 20% and at rated speed or higher speeds 10%. • In order to avoid downshifts to the 1. gear within a short trip, the choice of n_min_2 was deleted and replaced by the following requirements: 9
Modifications made for the 3. version • The minimum engine speed in 2. gear during acceleration phases starting from standstill is determined by the maximum of • 1,15*idling_speedor • 0,03*(rated_speed –idling_speed) + idling_speed • The minimum vehicle speed at which the 2. gear during deceleration phases or acceleration phases within a short trip will be kept is detemined by a theoretical corresponding engine speed of 0,9*idling_speed. • If this is fulfilled, the 2. gear is kept and the engine speed is set to the maximum as defined in the first bullet point on this slide as long as this value exceeds the theoretical corresponding engine. • In order to avoid engine stalling, the clutch is disengaged. 10
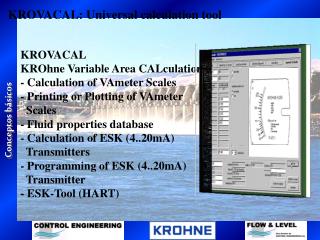
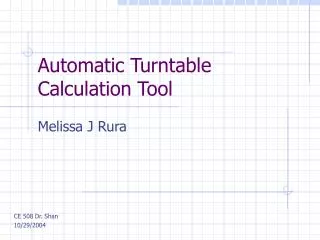
Modifications made for the 3. version • The application of a maximum speed cap was implemented into the tool. In cases where the original cycle speed exceeds the cap, the cycle speed is limited to the cap. • In addition to that the calculation tool was further modified in that way, that it reduces the vehicle speed in cases where the required acceleration exceeds the available acceleration power and where the maximum speed of the vehicle is lower than the cycle speed. • In order to enable the assessment of speed caps versus cycle downscaling, the latter was implemented as additional option for the extra high speed phases of the class 2 and class 3 cycles. • But the downscaling is restricted to the time sections with high speeds within the extra high speed phases (see figures 1 and 2). 11
Downscalingexample for class 3 versions 5.1 and 5.3 Figure1 12
Downscalingexample for class 2 version 2 Figure2 13
Remainingissues • The remainingissuesthatare not yet deltwithare: • The safety margin for the full load power curve needs to be updated/improved, the input data for the curve need to be simplified. • Uniform input data for a vehicle family. • The current n_min_drive concept is a bit more favourable for Diesel engines compared to Petrol engines. • The current approach aims at a compromise between economic driving and representativity with respect to in-use data. As a consequence the number of shift points is higher compared to a vehicle speed based system. • It should be assessed, how the number of shift points correlates with the in-use data. 14