Download
1 / 28
280 likes | 298 Views
Learn about approaches for converting assessment data into OSEP outcome categories. Understand the percentage of children who improved functioning and reach levels comparable to same-aged peers.

E N D
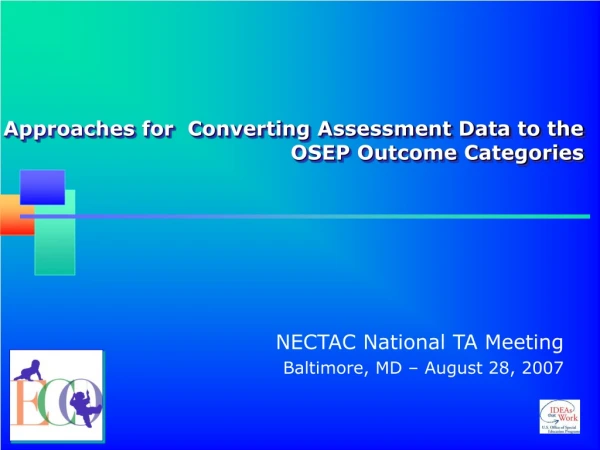
Approaches for Converting Assessment Data to the OSEP Outcome Categories NECTAC National TA Meeting Baltimore, MD – August 28, 2007
OSEP Reporting Categories Percentage of children who: a. Did not improve functioning b. Improved functioning, but not sufficient to move nearer to functioning comparable to same-aged peers c. Improved functioning to a level nearer to same-aged peers but did not reach it d. Improved functioning to reach a level comparable to same-aged peers e. Maintained functioning at a level comparable to same-aged peers 3 outcomes x 5 “measures” = 15 numbers
Child Outcomes Summary Form • Not an assessment tool • Mechanism for converting information from multiple sources (including assessment data) into a common metric • Yields ratings for each outcome on a 1-7 scale
Child Outcomes Summary From Ratings - Summary of 7 Points 7= Completely – age appropriate 6= Age appropriate, some concerns 5 = Somewhat - Some age appropriate 4 = Between 3 and 5 3 = Emerging - Not age appropriate but has immediate foundational skills 2 = Between 1 and 3 1 = Not yet - Not age appropriate and not immediate foundational skills
Entry 5
Entry Exit 6
Entry Exit 7
Key Point • The OSEP categories describe types of progress children can make between entry and exit • Two COSF ratings (entry and exit) are needed to calculate what OSEP category describes a child progress
e. % of children who maintain functioning at a level comparable to same-aged peers Rated 6 or 7 at entry; AND Rated 6 or 7 at exit How changes in ratings on the COSF correspond to reporting categories a - e
Entry Exit 10
Entry Exit 11
Entry Exit 12
d. % of children who improve functioning to reach a level comparable to same-aged peers Rated 5 or lower at entry; AND Rated 6 or 7 at exit How changes in ratings on the COSF correspond to reporting categories a - e
Entry Exit 14
c. % of children who improved functioning to a level nearer to same aged peers, but did not reach it Rated higher at exit than entry; AND Rated 5 or below at exit How changes in ratings on the COSF correspond to reporting categories a - e
Entry Exit 16
Entry Exit 17
b. % of children who improved functioning, but not sufficient to move nearer to same aged peers Rated 5 or lower at entry; AND Rated the same or lower at exit; AND Scored “Yes” on the progress question (b) How changes in ratings on the COSF correspond to reporting categories a - e
Entry Exit 19
Entry Exit 20
Entry Exit 21
a. % of children who did not improve functioning Rated lower at exit than entry; OR Rated 1 at both entry and exit; AND Scored “No” on the progress question (b) How changes in ratings on the COSF correspond to reporting categories a - e
Entry Exit 23
Entry Exit 24
Key Points • Improved functioning is defined as acquiring one new skill or behavior • In most cases (especially if the rating is higher than 1), children who receive the same rating at entry and exit will show improved functioning • E.g., 4 at entry and 4 at exit • The answer to the COSF “b” question (1b, 2b, 3b) is important for distinguishing between OSEP category a and OSEP category b.
Conversion COSF ratings to OSEP categories • Automatic conversion entry & exit data into categories • See www.the-eco-center.org • Under ECO tools: “calculator” in Excel with programmed decision rules • Tutor and handouts explaining algorithm for the conversion
COSF Calculator • Analytic calculator is only a start – programs/states may want to add more fields and more functions • E.g., to look at outcomes by how long the child was in the program. • The program is yours to use and modify as you see fit