TimeCube A Manycore Embedded Processor with Interference-agnostic Progress Tracking
560 likes | 576 Views
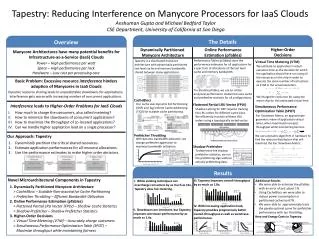
This paper presents a solution for measuring and guaranteeing execution quality in manycore embedded processors through the use of the new metrics - Progress-Time, Progress Tables, and SPOT (Simultaneous Performance Optimization Table). The paper also introduces a scalable manycore architecture and outlines the spatial distribution of critical resources.

TimeCube A Manycore Embedded Processor with Interference-agnostic Progress Tracking
E N D
Presentation Transcript
TimeCubeA Manycore Embedded Processor with Interference-agnostic Progress Tracking Anshuman Gupta Jack Sampson Michael Bedford Taylor University of California, San Diego
Multicore Processors in Embedded Systems • Standard in domains such as smartphones • Higher Energy-Efficiency • Higher Area-Efficiency Applied Micro Green Mamba Intel Atom Qualcomm Snapdragon Apple A6
Towards Manycore Embedded Systems • Number of cores in a processor is increasing • So is sharing! Quadcore Shared Cache, Shared Mem Dualcore Shared Mem Unicore Many(64)core Shared OCN, Shared Cache, Shared Mem etc.
What’s Great About Manycores • Lots of resources • Cores • Caches • DDR channels • Memory Bandwidth Xeon Phi 7120X 61 30.5MB 16 352GB/s Tile GX 8072 72 23MB 4 100GB/s
What’s Not So Great: Sharing Intel Xeon 4650 2.5 MB 4.26 B/cyc • Low per-core resources • Cache / core • Memory BW / core Tile Gx 8072 327 KB 1.16 B/cyc > 7X > 3X The applications fight with each other over the limited resources.
Sharing at its Worst SPEC2K, SPEC2K6 +I/O-centric suite • 32 cores, 16 MB L2 Cache, 96Gb/s DRAM bandwidth, 32GB DDR3 • 12Xworstcase slowdowns!
Key Problems With Sharing • I know how I’d run by myself, but how much are others slowing me down? • How do I get guarantees of how much performance I’ll get? • How do we allocate the resources for the good of the many, but without punishing the few, or the one? ! ! !
I know how I’d run by myself, but how much are others slowing me down? Solution: We introduce a new metric – Progress-Time • This Paper: With the right hardware, we can calculate the Progress-Time in real time. • Useful Because: Key building block for the hardware, for the operating system, and for the application to create guarantees about execution quality. Time the application would have taken, were it to have been allocated all CPU resources.
How do I get guarantees of how much performance I’ll get? Solution: We introduce a new hardware-generated data structure – Progress Tables – and we extend the hardware to dynamically partition resources. • This Paper: With a little more hardware, we can compute the Progress Tables accurately and accordingly partition resources to guarantee performance, in real time. • Useful Because: We can determine exactly how much resources are required to attain a given level of performance. For each application, how much Progress-Time it gets for every possible resource allocation
specrand Sneak Preview Graphical images of real Incremental Progress Tables generated in real time by our hardware Red= attaining the full 1ms of Progress-Time in 1ms of real time hmmer astar
How do we allocate the resources for the good of the many, but without punishing the few, or the one*? Solution: We introduce a new hardware-generated data structure – SPOT (Simultaneous Performance Optimization Table) • This Paper: With 3% more hardware, we can find near-optimal resource allocations, in real time. • Useful Because: Greatly improve system performance and fairness. For each application, how much resources should be allocated to maximize geomean of Progress-Times across the system. * Star Trek reference.
TimeCube: A Demonstration Vehicle for These Ideas • Scalable manycore architecture, in-order memory system • Critical resources spatially distributed over tiles
Outline • Introduction • Measuring Execution Quality: Progress-Time • Enforcing Execution Guarantees: Progress-Table • Allocating Execution Resources: SPOT • Conclusion
Measuring Execution Progress: Progress-Time • What do we need to compute Progress-Time? Current Universe Ideal (Shadow) Universe
Measuring Execution Progress: Progress-Time • What do we need to compute Progress-Time? Last Level Cache Memory Bandwidth DRAM Banks Execution Counters Current Universe Ideal (Shadow) Universe
Measuring Execution Progress: Progress-Time • What do we need to compute Progress-Time? + Last Level Cache Shadow Cache + Memory Bandwidth Shadow Prefetcher + DRAM Banks Shadow Banking + Execution Counters Shadow Counters Current Universe Ideal (Shadow) Universe
Shadow Structures • Shadow Tags • Measure cache miss rates for full cache allocation • Set-sampling reduces overhead • Shadow Prefetchers • Measure prefetches issued and prefetch hit rate • Track cache miss stream from Shadow Tags • Launch fake prefetches, no data buffers • Shadow Banking • Measure DRAM page hits, misses, and conflicts • Tracks current state of DRAM row buffers using DDR protocol
A Shadow Performance Model for Progress-Time • Analytical model to estimate Progress-Time • Takes into account the critical memory resources • Assumes no change in core pipeline execution cycles • Uses events collected from the shadow structures • Reuses average latencies for accessing individual resources ExecutionTime = corecycles +
Accounting for Bandwidth Stalls • L2 misses and prefetcherstatistics determine required bandwidth • No bandwidth stall assumed if sufficient bandwidth • If insufficient bandwidth, performance (IPC) degrades proportionally
Evaluation Methodology • Evaluate a 32-core instance similar to modern manycore processors • 26 benchmarks from SPEC2K, SPEC2K6, and an I/O-centric suite • Near unlimited combinations of simultaneous runs • Compress run-space by classifying apps into streams, cliffs, and slopesbased on cache sensitivity
Shadow Performance Model and Shadow Structures Accurately Compute Progress-Time 99% • TimeCube tracks Progress-Times with ~1% error • No latency overheads
Outline • Introduction • Measuring Execution Quality: Progress-Time • Enforcing Execution Guarantees: Progress-Table • Allocating Execution Resources: SPOT • Conclusion
Progress-Tables in TimeCube • One Progress-Table (Ptable) per application • Memory bandwidth binned in 1% increments • Last-level cache arrays allocated in powers of two • Progress-Time accumulated over intervals using last cell
Shadow Structures 2.0 • Shadow Tags • Measure cache miss rates for all power-of-two cache allocations • LRU-stacking reduces overhead • Shadow Prefetchers • Add one instance for each cache allocation • Shadow Banking • Add one instance for each cache allocation Same performance model is used as for Progress-Time.
specrand Progress-Tables Examples Ptables provide accurate mapping from resource allocation to slowdown TimeCube can use these maps to guarantee QoS for applications Overall as well as per-interval QoS control hmmer astar
Outline • Introduction • Measuring Execution Quality: Progress-Time • Enforcing Execution Guarantees: Progress-Table • Allocating Execution Resources: SPOT • Conclusion
Allocating Execution Resources: SPOT • Key Idea: Run optimization algorithm over application Progress-Tables to maximize an objective function • Objective Function: Mean Progress-Times of all applications, accumulated over all intervals so far and the upcoming one • Geometric-Mean balances throughput and fairness • The geomeancan be approximated to:
Implementation: Maximizing the Mean Progress-Time • Bin-packing: Distribute resources among applications to maximize mean • Clever algorithm allows optimal solution in pseudo-polynomial time • <All,All,All> corner gives maximum mean and corresponding allocation
Real-Time TimeCube Resource Allocation • Interval-based TimeCube execution • Statistics collected during execution • Every interval : • Estimate Progress-Times • Allocate resource partitions • Reconfigure partitions • Done in parallel with execution
Progress-Based Allocation Improves Throughput 77% • Allocating resources simultaneously increases throughput • As much as 77% increase, 36% improvement on average 36%
Maximizing Geometric Mean Provides Fairness 57% • Worstcase performance improves by 19% on average • As much as 57% worstcase improvement 19%
TimeCube’s Mechanisms are Energy-Efficient • Progress-Time Mechanisms consume < 0.5% energy • Shadow structures consume 0.23% • Ptable calculation consumes just 0.01% • SPOT calculation consumes 0.18%
TimeCube’sMechanisms are Area-Efficient • Progress-Time Mechanisms consume < 7% area • Shadow Tags consume 1.40% • Ptables consume 1.11% • SPOT consumes 3.20%
Related Work • Measuring Execution Quality [Progress-Time] • Analytical:Solihin [SC’99], Kaseridis [HPCA’10] • Regression: Eyerman [ISPASS’11] • Sampling: Yang [ISCA’13] • Enforcing Execution Guarantees [Progress-Tables] • RT systems: Lipari [RTTAS’00], Bernat [RTS’02], Beccari [RTS’05] • Offline: Mars [ISCA’13], Federova [ATC’05] • Allocating Execution Resources [SPOT] • Adaptive: Hsu [PACT’06], Guo [MICRO’07] • Offline: Bitirgen [MICRO’08], Liu [HPCA’04]
Conclusions • Problem: Interference on multicore processors can lead to large unpredictable slowdowns. • How to measure execution quality: Progress-Time • We can track liveapplication progress with high accuracy (~ 1% error) and low overheads (0.5% performance, < 0.5% energy, < 7% area). • How to enforce execution guarantees: Progress-Tables • We can use Progress-Tables to precisely control the QoSprovided, on-the-fly. • How to allocate execution resources: SPOT • We can use SPOT to improve both throughput and fairness (36% and 19% on average, 77% and 57% in best-case). • Multicore processors can employ these three mechanisms, demonstrated through TimeCube, to make them more attractive for embedded systems.
Thank You Questions?
Problem: Resource Sharing Causes Interference • Unpredictable slowdown during concurrent execution • Can lead to failed QoS guarantees
Progress-Tables • Progress-Time for a spectrum of resource allocations • Provide information for resource management at the right granularity
Dynamic Execution Isolation Reduces Interference • TimeCube partitions shared resources for dynamic execution isolation • Last-Level Cache Partitioning • Associative Cache Partitioning allocates cache ways to applications • Virtual Private Caches [Nesbit ISCA 2007] • Memory Bandwidth Partitioning • Memory bandwidth is dynamically allocated between applications • Fair Queuing Arbiter [Nesbit MICRO 2006] for memory scheduling • DRAM Capacity Partitioning • DRAM memory banks are split between applications • Row buffers fronting these banks are also partitioned as a result • OS page management maintains physical memory bank allocation
Prefetcher Throttling Increases Bandwidth Utilization • Filter fixed ratio of prefetches based on aggression level,such that required BW just above allocated BW • Shadow Performance Model augmented to give required BW
Prefetcher Throttling Chooses the Right-Level • Nine Aggression-Levels used • Throttler chooses the rightlevel to give pareto-optimal curve • Prefetcher throttling efficiently utilizes the available bandwidth
Prefetcher Throttling Chooses the Right-Level Pareto-Optimal • Nine Aggression-Levels used • Throttler chooses the rightlevel to give pareto-optimal curve • Prefetcher throttling efficiently utilizes the available bandwidth
Multicore Processors Share Resources • Leads to increased utilization • Lower per core resources on manycoreprocessors • Increasing pressure to share resources Low-Power Intel “Haswell” Architecture
Shadow Performance Model and Shadow Structures Accurately Compute Progress-Time • TimeCube tracks Progress-Times with ~1% error • Performance overheads due to reconfiguration are < 0.5%
Objective: Maximizing Mean Progress-Time • TimeCube allocates resources between applications to maximize the Mean Progress-Times • Geometric-Mean balances throughput and fairness • The geometric mean can be approximated to:
Measuring Execution Progress: Progress-Time • What do we need to compute Progress-Time? Dynamic Execution Isolation Shadow Performance Modeling Last Level Cache Shadow Cache Execution Stats Memory Bandwidth Shadow Prefetcher DRAM Banks Shadow Banking Ideal (Shadow) Universe Current Universe
Solution: Track Live Application Progress • Determine and control QoS provided to applications “online” • We quantify application progress using Progress-Time: Progress-Time is the amount of time required for an application to complete the same amount of work it has done so far, were to have been allocated all CPU resources.