Download
1 / 11

E N D
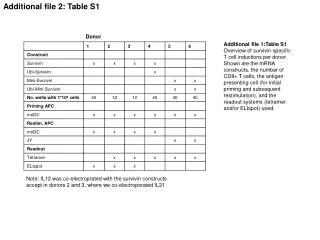
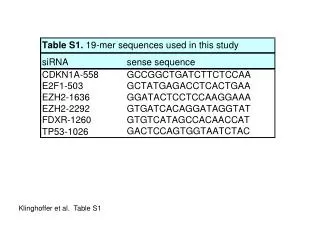
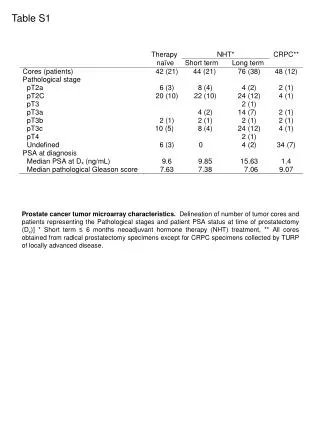
Table S1 Prostate cancer tumor microarray characteristics. Delineation of number of tumor cores and patients representing the Pathological stages and patient PSA status at time of prostatectomy (Dx)] * Short term ≤ 6 months neoadjuvant hormone therapy (NHT) treatment, ** All cores obtained from radical prostatectomy specimens except for CRPC specimens collected by TURP of locally advanced disease.
Fig. S1 Antibody + Peptide Antibody IRS-1 IRS-2 IRS antibody validation. Antibody Validation was performed by immunostaining PC3 xenografts with IRS-1 or -2 antibodies as described in Materials and methods with or without prior peptide blocking. IRS-1 or IRS-2 antibody was mixed together with peptide (sc-560P) or (sc-1555) respectively, at a mass ratio of 1:6 (0.8ug IRS-1 or 1.2ug IRS-2 antibody with 4ug or 6ug of respected peptide) and incubated at room temperature for 60 minutes and then used to stain slides as in Materials and Methods.
Fig. S2 Effect of NT157 on the viability of immortalized, non-transformed prostatic cell line. RWPE1 and normal prostatic fibroblasts were treated for 2 days with the indicated NT157 amounts. Both cells were cultured in 10% FBS media. Cell viability was determined by crystal violet assay as described in Materials and Methods.
Fig. S3 PC3 NT157 (uM) 0 2.5 5 10 5 0 Dotx (10nM) - - - - + + Cyclin D3 CDK4 Cyclin E2 CDK2 Cyclin B1 Actin LNCaP/CSS LNCaP/FBS NT157 (uM) 0 2.5 5 10 0 2.5 5 10 Dotx (10nM) - - - - - - - - Cyclin D3 CDK4 CDK2 Cyclin B1 Actin Immunoblot analysis of cell cycle markers in NT157 treated PC3 and LNCaP cell lines . LNCaP and PC3 cells were treated for 2 days with the indicated NT157 and/or Docetaxel (Dotx) amounts. LNCaP cells were cultured in 10% FBS media or 10% CSS media and PC3 cells were cultured in 10% of FBS media. Whole detergent cell lysates (30 µg) were subjected to SDS-PAGE and immunoblotted to assess cyclinD3, CDK4, cyclin E2, CDK2, cyclin B1 and β-actin levels.
Fig. S4 Vehicle NT157 NT157 treatment inhibits LNCaP xenograft growth and delays castration resistant progression. LNCaP cells were inoculated s.c. and when tumor volume exceeded 200 mm3, mice were castrated and randomly selected for treatment with 50 mg/kg of NT157 or vehicle (10% 2-HP-beta-CD + 0.67%NaCl in DDW) injected i.p. three times per week. Each line represents the tumor volume kinetics of an individual mouse in each treatment group (12 mice per group).
Table S2 Vehicle vs NT157: p = 8.06E-08 Growth rate calculation for NT157 treatment inhibits LNCaP xenografts. Slopes of individual animal tumor growth rates were calculated from the curves in Fig S4 by linear regression. The group average and standard error of the mean were used to compare difference between the vehicle and NT157 treatment groups by a paired t-test.
Fig. S5 NT157 treatment of LNCaP xenograft tumors has no effect on mice body weight. LNCaP cells were inoculated s.c. and when tumor volume exceeded 200 mm3, mice were castrated and randomly selected for treatment with 50 mg/kg of NT157 or vehicle (10% 2-HP-beta-CD + 0.67%NaCl in DDW) injected i.p. three times per week. Body weights of all mice were measured weakly. Each data point represents the mean body weight (g)in each group containing 12 mice ± SEM
Fig. S6 NT157 potentiates docetaxel activity in PC-3 xenograft model. PC3 cells were inoculated s.c. and when tumors reached 100 mm³, mice were randomly selected for treatment with the same protocol as LNCaP. Each line represents the tumor volume kinetics of an individual mouse in each group containing 7 mice in vehicle, 9 mice in NT157, 10 mice in docetaxel, and 16 mice in combination treated as described in Materials and methods (±SEM).
Table.S3 Growth Rate (mm3/week) Growth rate calculation for NT157 and Docetaxel treated PCs xenografts. Slopes of individual animal tumor growth rates were calculated from the curves in Fig S6 by linear regression. The average and standard error of the mean for each group was used to compare differences between the vehicle, NT157, Docetaxel and NT157+Docetaxel treatment groups by an ANVOA and Mann-Whitney post hoc test.. *** = p < 0.05; ns = indistinguishable.
Fig. S7 NT157 treatment of PC3 xenograft tumors has no effect on mice body weight. Mice body weight was measured weekly. Each point represents the mean body weight in each group containing 7 mice in vehicle, 9 mice in NT157, 10 mice in docetaxel, and 16 mice in combination treated as described in Materials and methods (±SEM).
Fig. S8 NT157 does not interfere with AKT or ERK activation in response to EGF stimulation.LNCaP cells were serum-starved in the presence or absence of 10 µm NT157 for 24 hours, then stimulated with 100 ng/ml EGF for 20 min. Whole detergent cell lysates (30 µg) were subjected to SDS-PAGE and immunoblotted to assess total and pS473 AKT and total and pTEpY ERK1 and 2 as described in Materials and Methods.