Figure 37.14
Figure 37.14. c. a. l. i. c. m. c. e. y. h. l. i. C. n. g. Energy flow. Chemical energy. Light energy. Heat energy. Chemical elements. Bacteria, protists, and fungi. Figure 37.UN02. Autotrophs. Heterotrophs. Herbivore (primary consumer). Carnivore (secondary
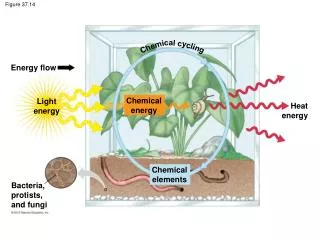

Figure 37.14
E N D
Presentation Transcript
Figure 37.14 c a l i c m c e y h l i C n g Energy flow Chemical energy Light energy Heat energy Chemical elements Bacteria, protists, and fungi
Figure 37.UN02 Autotrophs Heterotrophs Herbivore (primary consumer) Carnivore (secondary consumer) Producer Energy Chemical elements Light Detritus Decomposer Inorganic compounds (chemical elements)
Figure 37.8_s1 Trophic level Producers Plant Phytoplankton A terrestrial food chain An aquatic food chain
Figure 37.8_s2 Trophic level Primary consumers Grasshopper Zooplankton Producers Plant Phytoplankton A terrestrial food chain An aquatic food chain
Figure 37.8_s3 Trophic level Secondary consumers Mouse Herring Primary consumers Grasshopper Zooplankton Producers Plant Phytoplankton A terrestrial food chain An aquatic food chain
Figure 37.8_s4 Trophic level Tertiary consumers Snake Tuna Secondary consumers Mouse Herring Primary consumers Grasshopper Zooplankton Producers Plant Phytoplankton A terrestrial food chain An aquatic food chain
Figure 37.8_s5 Trophic level Quaternary consumers Hawk Killer whale Tertiary consumers Snake Tuna Secondary consumers Mouse Herring Primary consumers Grasshopper Zooplankton Producers Plant Phytoplankton A terrestrial food chain An aquatic food chain
Quaternary, tertiary, and secondary consumers Tertiary and secondary consumers Secondary and primary consumers Fig. 37-9 Primary consumers Producers (plants)
Figure 37.16A Plant material eaten by caterpillar 100 kilocalories (kcal) 35 kcal Cellular respiration 50 kcal Feces 15 kcal Growth
Tertiary consumers 10 kcal Secondary consumers 100 kcal Fig. 37-16 Primary consumers 1,000 kcal Producers 10,000 kcal 1,000,000 kcal of sunlight
Figure 37.UN03 Approximately 90% loss of energy at each trophic level Energy
Figure 38.2E Concentrationof PCBs Herringgull eggs124 ppm Tertiary consumers also get most of the environmental toxins Lake trout4.83 ppm Smelt1.04 ppm Zooplankton0.123 ppm Phytoplankton0.025 ppm
Figure 37.17 Trophic level Secondary consumers Meat-eaters Primary consumers Cattle Vegetarians Corn Corn Producers
Ecology describes the interaction among organisms and environment Biotic – biological community of organisms Fig. 34-1c Abiotic – physical and chemical envrionment (climate, soil, air, water)
Figure 34.18 Global water cycle – connects aquatic and terrestrial biomes Solarheat Net movementof water vaporby wind Water vaporover the land Water vaporover the sea Precipitationover the sea Evaporationandtranspiration Evaporationfrom the sea Precipitationover the land Oceans Surfacewater andgroundwater Flow of waterfrom land to sea
Figure 37.19 CO2 in atmosphere Burning 5 3 Photosynthesis Cellular respiration 1 Plants, algae, cyanobacteria Higher-level consumers 2 Wood and fossil fuels Primary consumers Decomposition Wastes; death Plant litter; death 4 Decomposers (soil microbes) Detritus
Figure 38.4B Photosynthesis Atmosphere Respiration Combustion offossil fuels Ocean
Figure 37.20 The phosphorus cycle does not have an atmospheric component. Rocks are the only source of phosphorus for terrestrial ecosystems. 6 Uplifting of rock 3 Weathering of rock Phosphates in rock Animals Plants Runoff 1 Assimilation Phosphate levels in aquatic ecosystems are typically low enough to be a limiting factor. 2 Detritus Phosphates in soil (inorganic) Phosphates in solution 5 Precipitated (solid) phosphates Decomposers in soil 4 Rock Decomposition
Figure 37.21 The atmosphere, is about 80% nitrogen gas Nitrogen (N2) in atmosphere 8 Animal Plant 6 Assimilation by plants 1 5 3 Denitrifiers The nitrogen cycle depends on bacteria Nitrogen-fixing bacteria in root modules Nitrates in soil (NO3) Detritus Decomposers Free-living nitrogen-fixing bacteria Nitrifying bacteria 4 7 Ammonium (NH4) in soil 2