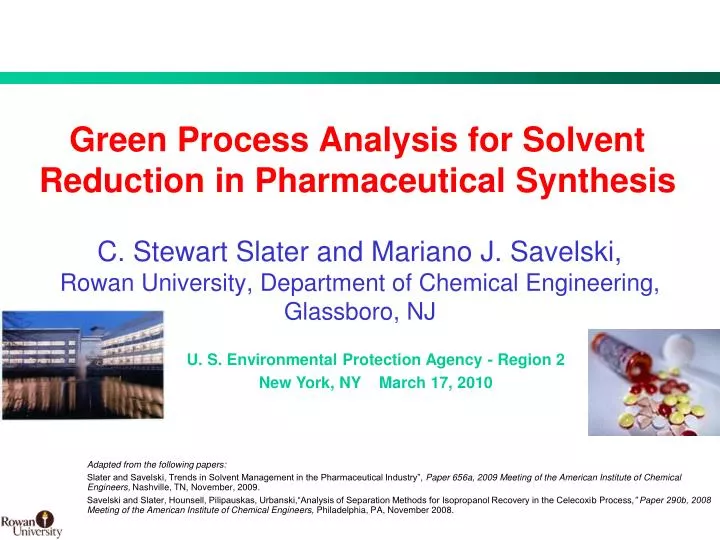
Green Process Analysis for Solvent Reduction in Pharmaceutical Synthesis
390 likes | 741 Views
The 11th Annual Green Chemistry & Engineering Conference. Green Process Analysis for Solvent Reduction in Pharmaceutical Synthesis. C. Stewart Slater and Mariano J. Savelski, Rowan University, Department of Chemical Engineering, Glassboro, NJ. U. S. Environmental Protection Agency - Region 2

Green Process Analysis for Solvent Reduction in Pharmaceutical Synthesis
E N D
Presentation Transcript
The 11th Annual Green Chemistry & Engineering Conference Green Process Analysis for Solvent Reduction in Pharmaceutical Synthesis C. Stewart Slater and Mariano J. Savelski, Rowan University, Department of Chemical Engineering, Glassboro, NJ U. S. Environmental Protection Agency - Region 2 New York, NY March 17, 2010 Adapted from the following papers: Slater and Savelski, Trends in Solvent Management in the Pharmaceutical Industry”, Paper 656a, 2009 Meeting of the American Institute of Chemical Engineers, Nashville, TN, November, 2009. Savelski and Slater, Hounsell, Pilipauskas, Urbanski,“Analysis of Separation Methods for Isopropanol Recovery in the Celecoxib Process,” Paper 290b, 2008 Meeting of the American Institute of Chemical Engineers, Philadelphia, PA, November 2008.
Academic-Industrial Interaction • Process case studies with a green chemistry and engineering component • Three pharmaceutical company partners • Bristol-Myers Squibb* • Novartis • Pfizer • Project outcomes show P2 impact • Waste reduced • Energy saved • Carbon footprint reduced • Cost saved • “Paper-projects” / design-based, experimentally-based or combination thereof N P B R Slater and Savelski, “Partnerships between Academia and the Pharmaceutical Industry to Advance Green Engineering,” EPA Conference on Creating Business Value: Green Quality through Green Chemistry and Green Engineering in the Pharmaceutical Industry, New York, NY, January 2008
Pharmaceutical Industry • Highly regulated • Long R&D timeline • Batch processes • High valued final product • API (Active Pharmaceutical Ingredient) • High E-factor • High solvent use and waste generated per final product
R-5 S-15 S-16 S-1 S-2 S-17 API I-1 I-5 R-1 I-1 I-5 I-5 I-1 I-5 Typical Drug Synthesis – “Campaigns” • Multi-step transformations – Intermediate compounds • Isolations (purification) S = Solvent – vary in number and complexity for each step R = Reactant – vary in number and complexity for each step I = Intermediate API = Active Pharmaceutical Ingredient
Solvent Issues • Solvent use can account for up to 80-90% of total mass of an API synthesis • Majority are organic solvents • Solvent costs over life cycle • Pay to purchase • Pay to use (energy and associated costs) • Pay to dispose • E-Factor 25->100 kg/kg of API • Not optimal by any standard • Practice green chemistry & engineering Sheldon, ChemInd, 1 (1997) 12 Slater and Savelski, J. Environ. Sci. Health, A42, 1595-1605, 2007
Pharma Industry Profile • US EPA Toxic Release Inventory (TRI) 2008 • 88 MMkg waste • Top ten solvents account for 72% of waste TRI.NET. Washington (DC): Environmental Protection Agency (US), Office of Environmental Information. 2009 - [modified 12/5/2009, cited 2/23/2009].
LCA System Boundaries Slater and Savelski, Innov. Pharma. Tech., 29, 78-83, 2009
Life Cycle Assessment Tools SimaPro 7.1 (Pré Consultants, Amersfoort, Netherlands) Features a large database of chemicals, materials, and processes (utilities) Generate modular LCAs for processes LCIs of raw material and energy use; emissions to the air, water, and ground Analysis of green house gas (GHG) emissions Ecosolvent (Safety and Environment Group, Zurich, Switz.) Moderate size database of chemicals Used to generate LCAs for waste solvent treatment and compare options
Major Waste Contributions • Basic Life Cycle Analysis • Shown for typical solvent manufacture • Waste Incineration w/ energy recovery – still method commonly used • Neglecting in-process use
Solvent Life Cycle Inventory Based on manufacture of 1 kg of Generic Solvent Soil <0.01% CO2 is 92% of life cycle emissions *Excluding water
Green Chemistry and Engineering • Greener solvent selection / solvent substitution • Elimination of highly hazardous solvents • Solvent reduction • Recovery techniques • Novel approaches to separations • Telescoping • Novel reaction media (ionic liquids) • Biocatalytic routes • Solid-state chemistry Slater and Savelski, Trends in Solvent Management in the Pharmaceutical Industry”, Paper 656a, 2009 Meeting of the American Institute of Chemical Engineers, Nashville, TN, November, 2009.
Rowan University Clinics • Modeled after medical schools • Student-faculty problem solving teams • Applied research, development, design • Partnership: Industry, Federal/State Agency, Foundation • Multidisciplinary • Two 3 hour labs/wk, 1 hr/wk meeting with professor/industry • Both semesters of Junior & Senior year and Masters students
Novartis Project • Development of greener adsorption process for pharmaceutical synthesis at East Hanover, NJ R&D facility • Heck coupling reaction used to produce pharmaceutical intermediate, A3, for multiple drug syntheses • Batch adsorption technique is currently used to remove palladium (Pd) catalyst from a reactor producing drug intermediate; A3 • Requires solvent and detergent rinses
Green Approach • Proposed greener fixed bed adsorption design is more efficient in Pd removal, reduces solvent and waste • Evaluate potential impact; lab scale process run at R&D facility was scaled-up in a simulation and analyzed for economic impact and environmental footprint
Batch Adsorption – Base Case • Scaling-up current process to 100 kg of A3 manufacturing scale
Greener Fixed Bed Adsorber (FBA) Design • Scaling-up proposed process to 100 kg of A3 manufacturing scale
Comparison of Two Processes • Significant methanol solvent reduction: 31,850 kg/yr • Significant water savings: 160,433 kg/yr • Values shown are kg/yr for annual production of 4,900 kg A3
Economic Comparison $1,558,000 64 % $597,000 4 % 80 % 32 % 2 % 18 % *Values shown are kg/yr for annual production of 4,900 kg A3
Life Cycle Inventory • Emissions generated by the various components of the solvent life cycle; from cradle to grave • Scaled up to annual production of 4,900 kg A3
Project Summary • Fixed Bed Adsorber design greener when examined through LCA • Total life cycle emissions reduced by 383,600 kg/yr, 94% reduction • CO2 reduced by 297,100 kg/y • Water utilization reduced 9.16 MM kg/yr, 95% reduction • Operating cost savings of $0.96 MM/yr, 62% reduction
Pfizer Project • Investigate solvent recovery alternatives to minimize waste from the Celecoxib manufacturing process • Compare current process route with green engineering options • Waste stream reduction and solvent recovery • Define operational sequences • Equipment and process steps required • Estimate costs and environmental impacts • Make proposal / recommendations
Project Approach • Analysis of large-scale API production at PR plant • Recovery of isopropanol from water, other alcohols and dissolved solids • Multiple waste streams with varying compositions • Azeotropic mixtures add complexity • Student team interacts with • Manufacturing group in New York, NY • Engineering group in Peapack, NJ • Plant operations in Barceloneta, PR
Process Flow Diagram • IPA solvent recovery from final purification steps • Segregate waste streams for best process design • Dryer Distillates and (Centrifuge) Wash • Mother Liquor • Pre-concentration for Incineration or Sale • Integration of existing separation equipment inventory at plant Recovery IPA / Water Washes 50% IPA 50% Water IPA / Water Washes 49.2% IPA 49.6% H2O 0.71% MeOH & EtOH 0.5% TDS Centrifuge Solvents Water API Other Mother Liquor 34.5% IPA 45.2% H2O 8.45% MeOH 2.71% EtOH 9.10% TDS Conc. & Sell ML Wet Product Solids Dryer Celecoxib Dryer Distillates 50.7% IPA 48.8% H2O 0.47% MeOH & EtOH 0% TDS Savelski and Slater, Hounsell, Pilipauskas, Urbanski,“Analysis of Separation Methods for Isopropanol Recovery in the Celecoxib Process,” Paper 290b, 2008 Meeting of the American Institute of Chemical Engineers, Philadelphia, PA, November 2008.
Green Design Analysis • Base case • Various design alternatives simulated with ASPEN • Distillation (Distill)-Pervaporation (PV) and Distill-PV-Distill • Distill-Molecular Sieve Adsorption • Sale of Mother Liquor or incineration options • Detailed analysis shown for • Distill–PV–Distill with Mother Liquor (ML) Sold Savelski and Slater, Hounsell, Pilipauskas, Urbanski,“Analysis of Separation Methods for Isopropanol Recovery in the Celecoxib Process,” Paper 290b, 2008 Meeting of the American Institute of Chemical Engineers, Philadelphia, PA, November 2008.
Proposed Distillation-PV-Distillation Process • Purification for only part of waste stream • Centrifuge wash and Dyer distillates for recovery • Mother liquor for (sale) use as generic solvent • Overall 57% IPA recovered @ 99.1 wt% for reuse in process • Other options of Distill-PV or PV only, yield different recoveries and purities Design basis of 1000 kg waste/hr is used for illustrative purposes Savelski and Slater, Hounsell, Pilipauskas, Urbanski,“Analysis of Separation Methods for Isopropanol Recovery in the Celecoxib Process,” Paper 290b, 2008 Meeting of the American Institute of Chemical Engineers, Philadelphia, PA, November 2008.
Life Cycle Inventory Comparison Total Base Case Emissions: 13.7 MM kg/yr Total Dist-PV-Dist Emissions: 1.12 MM kg/yr ~92% decrease in total emissions Savelski and Slater, Hounsell, Pilipauskas, Urbanski,“Analysis of Separation Methods for Isopropanol Recovery in the Celecoxib Process,” Paper 290b, 2008 Meeting of the American Institute of Chemical Engineers, Philadelphia, PA, November 2008.
Environmental Summary Operation of Distill-PV-Distill system adds small environmental burden from utilities consumed when compared to overall LCA Pre-concentration of ML and sale off-sets environmental impact of producing virgin “generic” solvent when examining LCA Major LCI reductions from IPA manufacture and incineration avoidance LCA summary: Distill-PV-Distill/sell ML Yearly reduction of 12.63 MM kg emissions/yr (92% reduction from base case) Yearly reduction of 11.55 MM kg CO2/yr (95% reduction from base case) Savelski and Slater, Hounsell, Pilipauskas, Urbanski,“Analysis of Separation Methods for Isopropanol Recovery in the Celecoxib Process,” Paper 290b, 2008 Meeting of the American Institute of Chemical Engineers, Philadelphia, PA, November 2008.
Economic Analysis 72% Annual Cost Savings $3.82 MM/yr operating cost saving Savelski and Slater, Hounsell, Pilipauskas, Urbanski,“Analysis of Separation Methods for Isopropanol Recovery in the Celecoxib Process,” Paper 290b, 2008 Meeting of the American Institute of Chemical Engineers, Philadelphia, PA, November 2008.
Benefits of Partnership Exchange of new technical ideas Publicity/community relations Presentations/papers – dissemination to wider audience Industry gains knowledge, new approaches to R&D → manufacturing University develops expertise to advance the state-of-the-art New engineers graduate with knowledge in green processes
Looking into the future: FY 2010 P2 Grant Initiative Top Most Used Solvents: typical mixtures Creation of a ready-to-use design tool to test candidate streams for source reduction Examine separation feasibility Modular recovery system design Calculate the environmental footprint reduction (LCA) Calculate profitability (less raw materials, less energy, and less waste disposal) Advancing the knowledge base and transferability across region 2 Workshops on current practices in pharmaceutical solvent reduction/reuse Workshops on Design Strategies for Solvent Recovery
Acknowledgements Pfizer Jorge Belgodere, Peter Dunn, Greg Hounsell, Daniel Pilipauskas, Frank Urbanski Novartis Thomas Blacklock, Michael Girgis • U.S. EPA Region 2 • Grant NP97257006-0 Rowan University Students Anthony Furiato, Kyle Lynch, Timothy Moroz, Michael Raymond, Nydia Ruiz