Transform quadratic functions.
Objectives. Transform quadratic functions. Describe the effects of changes in the coefficients of y = a ( x – h ) 2 + k. Vocabulary. quadratic function parabola vertex of a parabola vertex form.

Transform quadratic functions.
E N D
Presentation Transcript
Objectives Transform quadratic functions. Describe the effects of changes in the coefficients of y = a(x – h)2 + k.
Vocabulary quadratic function parabola vertex of a parabola vertex form
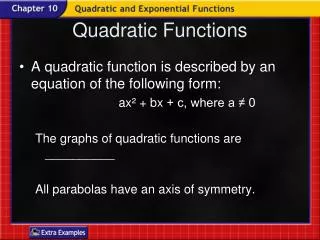
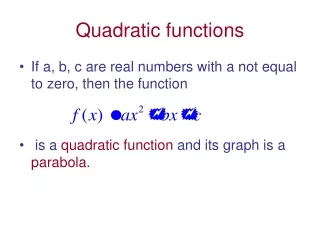
In Chapters 2 and 3, you studied linear functions of the form f(x) = mx + b. A quadratic function is a function that can be written in the form of f(x) = a (x – h)2 + k (a ≠ 0). In a quadratic function, the variable is always squared. The table shows the linear and quadratic parent functions.
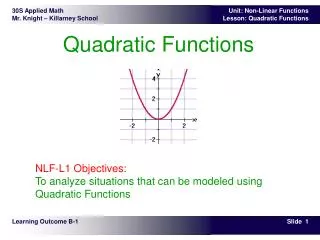
Notice that the graph of the parent function f(x) = x2 is a U-shaped curve called a parabola. As with other functions, you can graph a quadratic function by plotting points with coordinates that make the equation true.
Example 1: Graphing Quadratic Functions Using a Table Graph f(x) = x2 – 4x + 3 by using a table. Make a table. Plot enough ordered pairs to see both sides of the curve.
Example 1 Continued f(x) = x2 – 4x + 3 • • • • •
You can also graph quadratic functions by applying transformations to the parent function f(x) = x2. Transforming quadratic functions is similar to transforming linear functions (Lesson 2-6).
h k Example 2A: Translating Quadratic Functions Use the graph of f(x) = x2 as a guide, describe the transformations and then graph each function. g(x) = (x – 2)2 + 4 Identify h and k. g(x) = (x – 2)2 + 4 Because h = 2, the graph is translated 2units right. Because k = 4, the graph is translated 4units up. Therefore, g is f translated 2 units right and 4 units up.
h k Example 2B: Translating Quadratic Functions Use the graph of f(x) = x2 as a guide, describe the transformations and then graph each function. g(x) = (x + 2)2 – 3 Identify h and k. g(x) = (x – (–2))2 + (–3) Because h = –2, the graph is translated 2units left. Because k = –3, the graph is translated 3units down. Therefore, g is f translated 2 units left and 4 units down.
h k Check It Out! Example 2b Use the graph of f(x) =x2 as a guide, describe the transformations and then graph each function. g(x) = (x + 3)2 – 2 Identify h and k. g(x) = (x – (–3))2 + (–2) Because h = –3, the graph is translated 3 units left. Because k = –2, the graph is translated 2units down. Therefore, g is f translated 3 units left and 2 units down.
Recall that functions can also be reflected, stretched, or compressed.
Because |a| = , g is a vertical compression of f by a factor of . Example 3A: Reflecting, Stretching, and Compressing Quadratic Functions Using the graph of f(x) = x2 as a guide, describe the transformations and then graph each function. 1 ( ) =- 2 g x x 4 Because a is negative, g is a reflection of f across the x-axis.
Because b = , g is a horizontal compression of f by a factor of . Example 3B: Reflecting, Stretching, and Compressing Quadratic Functions Using the graph of f(x) = x2 as a guide, describe the transformations and then graph each function. g(x) =(3x)2
Because b = , g is a horizontal compression of f by a factor of . Check It Out! Example 3a Using the graph of f(x) = x2 as a guide, describe the transformations and then graph each function. g(x) =(2x)2
g(x) = – x2 Because |a| = , g is a vertical compression of f by a factor of . Check It Out! Example 3b Using the graph of f(x) = x2 as a guide, describe the transformations and then graph each function. Because a is negative, g is a reflection of f across the x-axis.
If a parabola opens upward, it has a lowest point. If a parabola opens downward, it has a highest point. This lowest or highest point is the vertex of the parabola. The parent function f(x) = x2 has its vertex at the origin. You can identify the vertex of other quadratic functions by analyzing the function in vertex form. The vertex form of a quadratic function is f(x) = a(x – h)2 + k, where a, h, and k are constants.
Because the vertex is translated h horizontal units and kvertical from the origin, the vertex of the parabola is at (h, k).
4 4 = Vertical stretch by : a 3 3 Example 4: Writing Transformed Quadratic Functions Use the description to write the quadratic function in vertex form. The parent function f(x) = x2 is vertically stretched by a factor of and then translated 2 units left and 5 units down to create g. Step 1 Identify how each transformation affects the constant in vertex form. Translation 2 units left: h = –2 Translation 5 units down: k = –5
= (x – (–2))2 + (–5) Substitute for a, –2 for h, and –5 for k. = (x + 2)2 – 5 g(x) = (x + 2)2 – 5 Example 4: Writing Transformed Quadratic Functions Step 2 Write the transformed function. g(x) =a(x – h)2 + k Vertex form of a quadratic function Simplify.
f g CheckGraph both functions on a graphing calculator. Enter f as Y1, and g as Y2.The graph indicates the identified transformations.