Download
1 / 16
160 likes | 174 Views
This study investigates the nonlinearities in the relationship between intercontinental ozone pollution and anthropogenic emissions, specifically focusing on the effects of NOx and VOC perturbations. The results demonstrate that NOx reductions significantly increase ozone production efficiency, while VOC perturbations show good linearity. The study also compares the sensitivity to intercontinental NOx perturbations among different regions and models. Overall, the findings highlight the complex nature of ozone pollution and the importance of emission reductions.

E N D
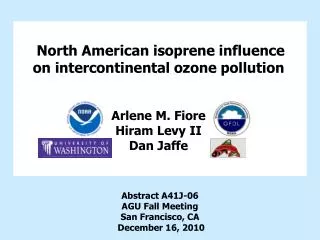
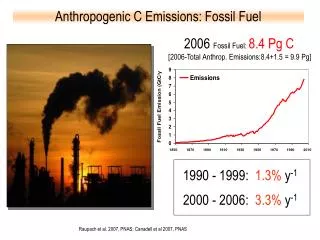
Chemical nonlinearities in relating intercontinental ozone pollution to anthropogenic emissions Shiliang Wu Bryan Duncan, Arlene Fiore, Oliver Wild, Daniel Jacob HTAP meeting, Washington, DC June 12, 2008 with support from the NASA/MAP program
Non-linearity in NOx perturbations (GMI – JJA)(surface ozone and changes due to perturbations in EA NOx emissions) (ppb) EA NOx -20% Control 3.0 2.0 0.4 0.1 -0.1 -0.4 -2.0 -3.9 70 60 50 40 30 20 10 Full perturb / (20% perturb x 5) EA NOx = 0 15.0 10.0 0.4 0.1 -0.1 -0.4 -2.0 -3.9 2.0 1.5 1.2 1.1 0.9 0.8 0.6 0.2 NOx reduction increases the ozone production efficiency
- - - - (effects from -20% NOx) x 5 ____ effects from -100% NOx Even stronger nonlinearity in NOx perturbations for non-summer seasons (GMI) Ozone production is most NOx-limited in summer and hence shows the best linearity
VOC perturbations show very good linearity (GMI – JJA)(surface ozone and changes due to perturbations in EA VOC emissions) (ppb) EA NMVOC -20% Control 0.3 0.2 0.1 0.01 -0.01 -0.1 -0.2 -0.6 70 60 50 40 30 20 10 EA NMVOC = 0 Full perturb / (20% perturb x 5) 2.0 1.5 1.2 1.1 0.9 0.8 0.6 0.2 1.5 1.0 0.5 0.05 -0.05 -0.5 -1.0 -3.5
- - - - (effects from -20% VOC) x 5 ____ effects from -100% VOC VOC perturbations show very good linearity for all seasonsand all source-receptor pairs Much less variability in OPE with regard to VOCs compared to NOx[Wang & Jacob, 1998]
EU EA NA O3 decrease with 0 EU NOx (EA O3 decrease from -20% EU NOx) x 5 Nonlinearity with EU NOx perturbations - model intercomparison EU NA Despite differences in ozone response magnitudes, all models show best linearity in summer. NA O3 decrease with 0 EU NOx (NA O3 decrease from -20% EU NOx) x 5
D (O3) from foreign NMVOC reduction D (O3) from same % foreign NOx reduction Relative benefit in controlling NMVOCs vs. NOx is larger with smaller magnitude of emission reductions GMI
Nonlinearity with EU NOx perturbations – model intercomparison EU EU
Region definition Fiore et al., 2008
Changes in surface ozone due to perturbations in ‘foreign’ emissions(GMI / spring) Relative importance of NOx vs. NMVOCs in intercontinental transport depends on the magnitude of emission reductions
Mutual comparison among different pairs in sensitivity to intercontinental NOx perturbations - - - - (effects from -20% NOx) x 5 effects from -100% NOx
Consistency and discrepancy across models(Changes in NA surface O3 due to changes in EU NOx emissions) • - - ( perturbations from -20% EU anthro. NOx) x 5 • __ perturbations from zeroing out EU anthro. NOx MZ = MOZART-v2 (Arlene Fiore) FR = FRSGCUNI (Oliver wild)
Consistency and discrepancy across models(Changes in NA surface O3 due to changes in EU anthropogenic emissions) • - - ( perturbations from -20% all EU anthro. emis) x 5 • __ perturbations from zeroing out EU anthro. emis