Download
1 / 46
460 likes | 622 Views
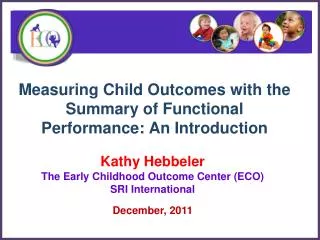
Child Outcomes: What We Are Learning from National, State, and Local Data. Kathy Hebbeler ECO at SRI International Lynne Kahn ECO at FPG Child Development Institute. Presented at Division for Early Childhood National Harbor, Maryland November, 20111. Topics.

E N D
Child Outcomes: What We Are Learning from National, State, and Local Data Kathy Hebbeler ECO at SRI International Lynne Kahn ECO at FPG Child Development Institute Presented at Division for Early Childhood National Harbor, Maryland November, 20111
Topics • Why outcomes data are collected? • State approaches • National data • Use of the data at state and local levels Early Childhood Outcomes Center
Let’s get acquainted Early Childhood Outcomes Center
Why does the federal government want data on child outcomes? • Government Performance and Results Act (GPRA) • Program Assessment Rating Tool (PART) • Individuals with Disabilities Education Act (IDEA) 4 Early Childhood Outcomes Center
Government Performance and Results Act (GPRA) passed in 1993 • Requires goals and indicators be established for federal programs, including IDEA • Indicators and data collection for school age population included data on outcomes • Previously, for early childhood data had been reported on: • Number of children served (Part C) • Settings (both Part C and 619
OSEP: PART evaluation results (2002) • 130 programs examined in 2002; 50% programs had no performance data • Programs looking at inputs, not results • Part C and Section 619 • No child outcome data - “results not demonstrated” • Department of Education needs to develop a strategy to collect annual performance data in a timely manner Early Childhood Outcomes Center
IDEA 2004 SEC. 616. <<NOTE: 20 USC 1416.>> MONITORING, TECHNICAL ASSISTANCE, AND ENFORCEMENT. ``(a) Federal and State Monitoring.….. (2) Focused monitoring.--The primary focus of Federal and State monitoring activities described in paragraph (1) shall be on-- (A) improving educational results and functional outcomes for all children with disabilities; The word “results” appears 65 times in the legislation.
$373,351,000 $438,548,000 Early Childhood Outcomes Center
State and Local Uses • Accountability • Justifying the investment in EI and ECSE • Program Improvement • Using data to identify program strengths and share them • Using data to identify program weaknesses and address them Early Childhood Outcomes Center
Reporting Requirement for Early Intervention and Preschool Special Education Early Childhood Outcomes Center
OSEP Reporting Requirements: Child Outcomes • Positive social emotional skills (including positive social relationships) • Acquisition and use of knowledge and skills (including early language/ communication and early literacy) • Use of appropriate behaviors to meet their needs
What States Report:OSEP Reporting Categories Percentage of children who: a. Did not improve functioning b. Improved functioning, but not sufficient to move nearer to functioning comparable to same-aged peers c. Improved functioning to a level nearer to same-aged peers but did not reach it d. Improved functioning to reach a level comparable to same-aged peers e. Maintained functioning at a level comparable to same-aged peers 3 outcomes x 5 “measures” = 15 numbers 12
Reporting details • Progress for all children who exited between July 1, 2009 and June 30, 2010 • Stayed in the program at least 6 months • Data reported to OSEP in February of each year. • Progress data first submitted in 2008 Early Childhood Outcomes Center
The Summary Statements • Of those children who entered the program below age expectations in each outcome, the percent who substantially increased their rate of growth by the time they turned 3 [6] years of age or exited the program. • The percent of children who were functioning within age expectations in each outcome by the time they turned 3 [6] years of age or exited the program. Early Childhood Outcomes Center
Formula for SS 1 (c+d)/(a+b+c+d) 16 16
Formula for SS 2 (d+e)/(a+b+c+d+e) 17
Timeline Early Childhood Outcomes Center
…and now there are national data Early Childhood Outcomes Center
…one day we get a request • From the U.S. Department of Education • Include the child outcomes data as a GPRA indicator? • Also, in President’s budget justification for Part C and Preschool 619 funding? • Initial request received in 2010, repeated in 2011. Early Childhood Outcomes Center
The Dilemma • Variations in quality of state data • Some states started earlier • Some states had devoted more attention to improving quality What would be the impact of state variation in data quality on the national numbers? Early Childhood Outcomes Center
Our Response: Compute the analyses several ways Identify the states with the highest quality data and use only their data. Stratify by number of children served and weight data to produce national estimate. • Use data from all states. Weight data to represent the nation. • Weighting necessary because a few states are sampling. Also, many states not reporting data on all children. Early Childhood Outcomes Center
Note: Based on 29 States with highest quality data Early Childhood Outcomes Center
Note: Based on 29 States with highest quality data Early Childhood Outcomes Center
Note: Based on 33 States with highest quality data Early Childhood Outcomes Center
Note: Based on 33 States with highest quality data Early Childhood Outcomes Center
Can we trust these data? Early Childhood Outcomes Center
Pattern checking for validity • Checking across years • How do the 2009-10 data compare to the data for 2008-09? • Checking across methods • How do the data for all states compare to states with highest quality data? Early Childhood Outcomes Center
Possible interpretation of the data • Nationally, a high proportion of children who receive Part C and ECSE services are showing greater than expected progress • Nationally, many (over half) are exiting the program functioning like same age peers in at least one of the outcomes. Early Childhood Outcomes Center
Would you agree? Early Childhood Outcomes Center
Should each state’s data look like the national data? • Probably not • More important that each state continue to focus on the quality of its own data • Getting outcomes data on all children who exit • Working with programs whose data look unusual to address possible data quality issues Early Childhood Outcomes Center
For more information • For updates to the framework and the self-assessment and resources to support the quality indicators: www.the-eco-center.org Early Childhood Outcomes Center
Additional Information Early Childhood Outcomes Center
Criteria for States with Quality Data • Low percentage of missing data • No odd patterns in “a” or “e” categories • Did not use questionable data collection methods Early Childhood Outcomes Center
Calculating Missing Data for Part C Proxy for missing data = Number with data for C3/ Exiting Data (618) • Do not expect this number to be 100% • ..but we don’t expect it to be 10% either Early Childhood Outcomes Center
Part C: Percent of Exiters included in Outcomes Data 08-09 <10% = 10* 10- 20% = 4 20- 30% = 8 30- 40% = 11 40- 50% = 8 50- 60% = 8 60- 70% = 4 70- 80% = 2 >80% = 1 09-10 <10% = 5* 10- 20% = 4 20- 30% = 6 30- 40% = 8 40- 50% = 5 50- 60% = 11 60- 70% = 9 70- 80% = 1 >80% = 0 *3 states are sampling for Part C. Cut off was > 27%.
Calculating Missing Data for 619 Proxy for missing data = Number with data for B7/ Child count • Do not expect this number to be 100% • ..but we don’t expect it to be 10% either Early Childhood Outcomes Center
Odd Patterns in a or e • a = % of children who show no new skills • Except this to be very small. • e = % of children who maintained functioning comparable to age expectations. • Don’t expect this to be large. • Quality defined as <10% in a and <65% in e. Early Childhood Outcomes Center
Percent of Child Count included in Outcomes Data for ECSE 08-09 <10= 11* 10- 20%= 15 20- 30%= 12 30- 40%= 12 40-50% =1 >50% = 2 09-10 <10= 6* 10- 20%= 11 20- 30%= 12 30- 40%= 16 40-50% =4 >50%= 0 *4 States are sampling for 619 Cutoff was > 11%.