Download
1 / 17
170 likes | 292 Views
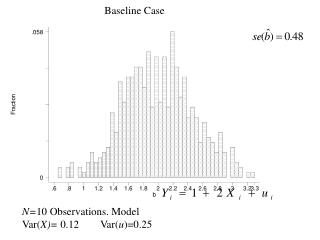
Sweet Sea Observations: How Great Lakes Observations can Work for You June 21, 2011. Overview. Ontario Clean Water Act – Source Water Protection Program Lake Erie Source Protection Region – Characteristics Timelines for Plan Development Vulnerable Areas – Surface W ater

E N D
Sweet Sea Observations: How Great Lakes Observations can Work for You June 21, 2011
Overview • Ontario Clean Water Act – Source Water Protection Program • Lake Erie Source Protection Region – Characteristics • Timelines for Plan Development • Vulnerable Areas – Surface Water • Approach to Establishing Protection Zones • Hydrodynamic Model and Data Needs • Conclusions
The Ontario Clean Water Act • Passed in 2006 to implement recommendations on source protection in the Walkerton Report • Protect current andfuture drinking watersources fromcontaminationand depletion • One of five layers in a‘multi-barrier’ approach
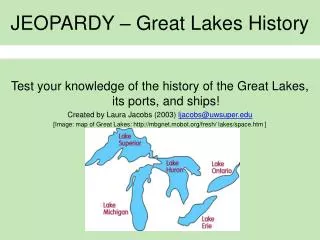
Lake Erie SourceProtection Region • Kettle Creek • Grand River • Long Point Region • Catfish Creek • One plan will be developed for each watershed • Process led by multi-stakeholder Source Protection Committee
Steps in the process • Characterization Reports: Complete • Terms of Reference: Complete • Technical studies: Complete • Assessment Reports: Nearing completion • Source Protection Plans: complete by2012
Vulnerable Areas and Threats Vulnerable areas include: • Wellhead Protection Areas (WHPA) • Intake Protection Zones (IPZ) Threats • Kettle Creek – 2 • Catfish Creek – 32 • Long Point Region – 343 • Grand River – 6912 TOTAL Threats = 7289
Intake Protection Zones • How quicklycan pollutantsget to the intake? • Three zones: • IPZ 1: 1 km around intake • IPZ 2: 2-hour Time of Travel • IPZ 3: upstream areas • Vulnerability ratedon 10-point scale • Alternate method:‘events-based’ reviewof local conditions IPZ – 3
Hydrodynamic Model Bathymetry • Various surveys (CHS, NOAA) Water Levels • Port Stanley (CHS) Waves • Mostly offshore buoys (MEDS, NOAA, MNR) Temperature • Buoy (MEDS) Currents • Consultant survey
Hydrodynamic Model Use Hydrodynamic model was used to: • Delineate the in-water area of an IPZ-2 • Conduct event based modeling for the designation of an IPZ-3 IPZ-2 • Used critical combinations of wind and wave stress (10 year) to delineate the area of the 2 hour time of travel to the intake
Hydrodynamic Model – IPZ-3 IPZ-3 Event Based Approach • 2 possible spill scenarios were investigated under extreme event conditions: • 5000m3 of Urea Ammonium Nitrate at the mouth of Kettle Creek (50m3/s flow rate in Kettle Creek and 10 m/s wind speed) • 6000L of Diesel Fuel to a drain discharging near the intake (5 m/s offshore wind)
Hydrodynamic Model – IPZ-3 Example of Results: Urea Ammonium Nitrate Spill Scenario 27 hour spill (27 hours after spill) 1 hour spill (27 hours after spill) Concentration of Nitrate at the intake would exceed benchmark levels and should be included as a significant drinking water threat
Uncertainty and Gaps • Limitations to the models based on time and resources constraints • Wave and wind measurements were from areas offshore from the intake locations • Water currents information was very limited and additional information was gathered to complete the model • Event modeling for IPZ3 included many assumptions on extreme conditions
Conclusion • Science-based approach to protecting drinking water sources • Used available as well as new observations to establish protection zones and identify drinking water threats • Established process to deal with uncertainty and data gaps • peer review process • mandatory documentation in Assessment Report as per technical rules