Download
1 / 30
300 likes | 329 Views
Explore integrated assessment of 32 European cities' responses to environmental sustainability, climate change, and social-economic trends. Urban Ecosystem Europe aligns with EU policies and indicators for sustainable urban development.

E N D
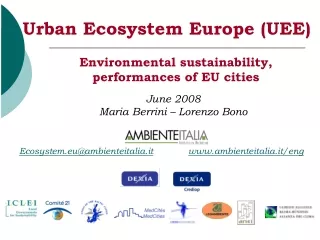
Urban Ecosystem Europe (UEE) Environmental sustainability, performances of EU cities June 2008 Maria Berrini – Lorenzo Bono Ecosystem.eu@ambienteitalia.itwww.ambienteitalia.it/eng
Urban Ecosystem Europe – Aims The Urban Ecosystem Europe Report provides an integrated assessment (25 indicators) of 32 mainor bigger cities in Europe and focuses on their local responses capacity and needs. The report shows strengths and weaknesses and the 2007 update provides a baseline review clearly addressed to the environmental sustainability dimension, with climate change as core issue. The Report highlights city environmental performances in the framework of other social and economic patterns and trends.
Urban Ecosystem Europe: a tool coherent with EU policies engagements The 2005 EU reports “Cohesion Policy and Cities" and "Cities and the Lisbon Agenda" state that “Operational funding Programmes should include integrated plan for sustainable urban development and clear description of urban priorities”. The 2006 EU - Thematic strategy on the urban environment says that “To monitor and up-date the effectiveness of the Strategy, accessible urban data is needed” and the EU Parlament (2006) demands “common core indicators to allow for comparisons and benchmarking between European cities…” The 2004-07 Aalborg commitments engage signatories “to cooperate with the European Sustainable Cities & Towns Campaign and its networks to monitor and evaluate progress towards meeting sustainability targets”. The 2007 EU Leipzig Chart for Sustainable Cities says that “Indicators and Benchmaking should become a relevant tool to drive European, national and local policies”.
The themes • Local action for health - Natural common goods. • Responsible consumption and lifestyle choices. • Planning, design-Better mobility, less traffic. • Local to global: Energy and Climate change. • Vibrant, sustainable local economy and Social equity, justice and coesion. • Local Management towards sustainability and Governance.
The 25 indicators • Air quality: PM10concentrations • Air quality: NO2 concentrations • Noise map and noise reduction plan • Domestic waterconsumption • Inhabitants served by water treatment plants • Electric consumption variation • Amount of municipal waste produced • Municipal waste, differentiated collection • Green public procurement, procedures and purchasing • Passengers travelling on public transport • Underground and tram lines in the urban area • Number of registered cars
The 25 indicators • Cycle paths and lanes availability • Public green areas availability • Energy Balance and CO2 reduction target • Solar power generation in public buildings • Inhabitants connected to district heating system • Climate and Energy saving policies • Demographic and old age dependency • Female employment • Population qualified at highest level of education • Env.Certification of public authorities • Level of mplementation of Agenda 21 processes • Electorate voting in city elections • City representatives who are women
Data search (with cities) • Data collection: Ambiente Italia sends a Form (definitions, measure units and methods) to the right contact in the cities (thanks to partners). • Data reliability: Local Administrations fill the form in and take the formal responsibility of data. • Quality control: Ambiente Italia takes care of a final quality control, looking at internal coherence of data, cross checking with other source of data and sending data back to the cities for a final agreement.
Metropol. areas Big Medium Medium-small Berlin G. London G. Lyon Madrid Paris Roma Barcelona Brussels Milano Napoli Praha Wien Munchen Antwerpen Kobenh. Dresden Goteborg Helsinki Riga Stockholm Zaragoza Hannover Oslo Bristol Aarhus Heidelberg Lefkosia Tampere Turku Patra Durres Aalborg 32 cities - 16 Countries 10 northern; 10 central; 9 southern; 3 eastern
How is critical the situation? Are there positive reactions? • 1. European citizens are exposed to relevant health risks, due to air pollution. The situation is still over the limit. • 2. Car users are invading cities, but local policies could succeed. • 3. Municipal waste are a waste of energy and materials, but local policies and life styles can make the difference. • 4. Risks due to climate changes could be avoided also thanks to local administrations, but now it’s time to act.
Air pollution: the situation is still over the limit • 45% of the 32 cities does not respect the PM10 yearly limit value set for 2005 (40 g/m3)and more than 90%exceeds the 2010 target (20 g/m3). • Almost all cities (84%) exceed the present limit value referred to PM10 daily exceedanceof 50 g/m3, and about 7 cities more than 3 times. • 60% of the cities doesn’t respect at least in one sample point (hot spot) the NO2 yearly average limit value of 50 g/m3 set for 2005 and 90% exceeds the 2010 target (40 g/m3). • The worst situations are registered in G.London, Milano, Roma, Madrid, Barcelona, Praha, G. Lyon. • Helsinki, Goteborg and other 4 northern cities (the smaller) are the only ones in line with the EU Directive.
Carusers are invading cities, but local policiescould compete • Car is used up to 70% for home to work trips in Italian cities, that, together with the Belgians havethe higher number of circulating cars (or – if not circulating - taking public spaces): Naples and Milan exceed 60 cars every 100 inhabitants and Rome even reaches 70 cars, compared with lower data from Berlin and London (30), Paris (26), Riga and Kobenhavn (20). • In Praha workers use public transport (58%) more then cars (27%). Wien, Goteborg, Helsinki, Hannover, Kobenhavn and Stockholm achieved the goal to mantain below 50% the use of car in home to work trips, thanks to the combined use of the bicycle in short medium trips and a qualified public transport related to longer trips.
Bike is an urban alternative to car, if integrated with TP and well protected Smaller cities (<300.000 inhab.) as Turku, Aalborg, Tampere and Aarhus offering a cycling network of about 300 km achieved the result to convince about the 20% of citizens to use the bicycle also for home-to-work trips. Also medium sized cities offer focused policy, as Helsinki (>1.500km of lines), Stockholm and Hannover (about 750km). Hannover and Kobenhavn implemented also speed reduction on a significant part of their roads (660 and 117 km respectively) and now register the maximum use of bicycle in home-to-work trips (29%. In Kobenhavn). Among bigger cities the best are Wien and Munchen.
Municipal waste, local policies and life styles can make the difference • Waste production is growing almost everywhere, more then 400-500kg/inhab/year. • Some administrations, thanks to good separated collection policies and rates (in some cases over 50%), are able to recycle and so to reduce the amount of residual waste to be disposed: Dresden and Munchenunder 200kg/inhab and Berlin, Goteborg, Kobenhavn and Antwerpen under 300 kg/inh. Aalborg, the city with the highest per capita waste production (680 kg/inh) reduces the residual waste to 250 kg/inh, thanks to a very high separated collection rate (62%). • Napoli, Roma, Patra, Lefkosia, Paris and London register more than 450kg/inhab/year residual waste to be disposed, due to low separation rates.
Risks due to climate changes could be avoided, but now it’s time to act • A good majority (21) of the 32 cities adopted local CO2reduction targets. • Barcelona, Hannover, Munchen, Oslo, Zaragoza, Praha and Roma defined very innovative local regulations to improve energy efficiency in their building stocks. • Solar panels diffusion in public buildings is growing: Wien is the best for thermal panels (about 13.000 m2). Good also Barcelona (4.300 m2) and Lyon (3.500 m2). Munchen is the absolute winner for photovoltaic panels on public buildings (more then 4.000 kW), followed at a certain distance by Barcelona and Roma. Heidelberg - as the first -and then Hannover, Helsinkiand Dresda are the best among smaller sized cities. • In Helsinki, Kobenhavn, Aarhus, Tampere and Stockholm more than 70% of the population is connected to a district heating system.
Is a sustainable city achievable? It could be if… • The air quality standards are respected as in Goteborg (and Helsinki). • Water consumptionsare 100 liters/inhab, as in Dresden, Zaragoza and Heidelberg and 100% of inhabitants is served by water treatment (as most european cities, but not all). • Waste productionis under 334kg/inhab/year as in Dresden or, at least, not differentiated waste are under 250kg/inhabitants/year as in Munchen and Antwerpen, thanks to separate collection up to 62% as in Aalborg or upto 50% as in Hannover and Helsinki.
Is achievable a sustainable city? It could be if… • Public procurementsare extensively green as in Kobenhavn and electric consumptions in the last 5 years have been reduced, as in Oslo (-26%). • The public transportis widely used as in Prague,Stockholm and Wien (58, 47 and 45% of home to work trips) and citizens are satisfied of its quality as in Wien, Munchen and Berlin. • Car is usedless than other means, as in Barcelona and Madrid (35% of the total home to work trips) and its ownership is a “past life style” as in Kobenhavn and Riga (20 cars/100 inhab.) or as in Berlin, London, and Paris (30).
Is achievable a sustainable city? It could be if… • Bicycle is the mean of transport of the future as in Kobenhavn (29%) also thanks to a widebike network as in Helsinki (1.500 km), in Stockholm and in Hannover (about 750 km). • Citizens have more then 200 sqm each of green areas (of which more then 40 sqm/inhab of urban parks), as in Oslo and in Goteborg. • A large number of public buildings use solar panels to produce hot water or electricity as in Wien, Munchen and Barcelona and have been audited and retrofitted to improve their energy efficiency as the 80% of them in Helsinki
Is achievable a sustainable city? It could be if… • More then 93% of the population is served by district heating as in Helsinki andin Kobenhavn andmore than 25% of municipality’s energy consumptions is “green” as in Oslo and Heidelberg. • Integrated environmental management schemes (ISO or EMAS) have been applied to improve the efficiency of the public administrationsas inKobenhavn, Bristol and Osloand Agenda 21 participated processeshave been well developed as in Aalborg, Hannover, Munchen and Stockholm.
Is achievable a sustainable city? It could be if… • Women role is promoted (> 70% activity rate in the labour market) as in all nordic and german cities and is recognised (>50% of elected representatives in the municipality) as in Stockholm. • The city environment is friendly for children and attractive for young people, as in Kobenhavn, Munchen, Berlin, and citizens have very high educational level as in Dresden, Praha and the other german cities. • Citizens participate to local election (>80%) as in Riga and in all the Danish, Belgian and Italian cities.
City profiles: compare yourself with the best you could achieve!
Urban Ecosystem Europe Welcome to new participating cities, other endorsers and sponsors, to ensure the periodical maintenance of the reporting mechanism! Thanks ! Maria Berrini – Lorenzo Bono ecosystem.eu@ambienteitalia.it www.ambienteitalia.it/eng