Download
1 / 34
340 likes | 516 Views
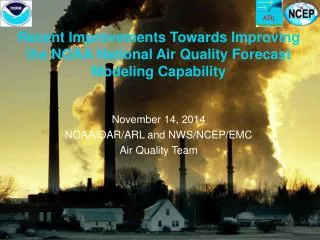
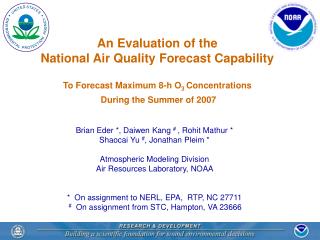
An Evaluation of the National Air Quality Forecast Capability To Forecast Maximum 8-h O 3 Concentrations During the Summer of 2007. Brian Eder *, Daiwen Kang # , Rohit Mathur * Shaocai Yu # , Jonathan Pleim * Atmospheric Modeling Division Air Resources Laboratory, NOAA

E N D
An Evaluation of the National Air Quality Forecast Capability To Forecast Maximum 8-h O3 Concentrations During the Summer of 2007 Brian Eder *, Daiwen Kang # , Rohit Mathur * Shaocai Yu #, Jonathan Pleim * Atmospheric Modeling Division Air Resources Laboratory, NOAA * On assignment to NERL, EPA, RTP, NC 27711 # On assignment from STC, Hampton, VA 23666
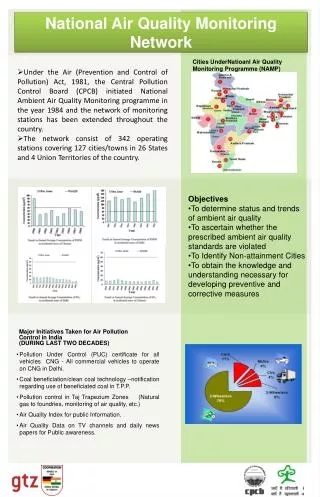
Background The real-time National Air Quality Forecast Capability (NAQFC), developed through a collaborative effort between NOAA and EPA, has expanded in both its capacity and coverage since mandated by Congress under the Energy Policy Act of 2002. Initial deployment in September 2004 Expanded in September 2005
Background During the two years since its 2005 “transition to operations”, numerous upgrades were tested and eventually incorporated into the NAQFC. First, and most significantly, NCEP’s Eta meteorological model was replaced with the North American Mesoscale (NAM) meteorological model run of the Weather Research and Forecast (WRF) model Second, advances to CMAQ were tested and implemented that improve simulation of cloud mixing and planetary boundary layer dynamics. Third, updates to emissions estimates, concentrating on mobile sources and electrical generating units were incorporated. And finally, the spatial domain was expanded to encompass the contiguous United States (CONUS) and bordering areas. http://www.nws.noaa.gov/aq
CONUS NAQFC Transitioned into Operations: 18 September 2007
National Air Quality Forecast Capability CONUS Domain Uses the NAM model run of the WRF model, which consists of the Nonhydrostatic Mesoscale Model (NMM) configured with CMAQ. Emissions are processed using SMOKE based on the 2001 NEI (w/ updates) Version 4.2 Carbon Bond chemical mechanism. 12 km grid resolution, 442 x 265 = 117,130 grid cells. 22 layers extending from the surface to 100 hPa. Initial condition chemical fields are specified using the previous forecast cycle. The target forecast period is local midnight through local midnight. An additional eight hours are required beyond midnight to calculate peak 8-h average O3 conc., as a result: a 48-h NAM–CMAQ forecast is needed (based on a 12 UTC initialization) to obtain the desired 24-h forecast period.
Evaluation Protocol - Used hourly O3 concentrations (ppb) from EPA’s AIRNOW network: • > nearly 1100 monitors, • - Observations were matched/compared directly to grid cells, • - i.e. no interpolation/smoothing was used; • - Statistical metrics for discrete forecasts for the maximum 8-hour O3 • forecasts: RMSE, NME, MB, NMB, correlation.
Evaluation Protocol Spatial - CONUS - Regions NE, SE, UM, LM, RM, PC (California) Temporal - Daily: 1 June – 30 September, 2007 - Monthly Summaries (J, J, A, S) - Summer Season (J, J, A)
Summer Weather The summer (J, J, A) of 2007 was considerably warmer than normal, the exception being the Northeast, which was near normal and lower Midwest, where record rainfall kept temperatures below normal.
Ozone Season Despite the generally conducive conditions, the number of days reaching “Unhealthy for Sensitive Groups” or higher, was considerably lower than the 10 year average.
Summer (J, J, A) Discrete Statistics for the CONUS Max. 8-hour Ozone
Summer (J, J, A) Discrete Statistics for the CONUS Max. 8-hour Ozone
Summer (J, J, A) Discrete Statistics for the CONUS Max. 8-hour Ozone Note very low correlations south coast of CA
Discrete Statistics for the CONUS Max. 8-hour Ozone
Summer (J, J, A) Discrete Statistics for the CONUS Max. 8-hour Ozone
Summer (J, J, A) Discrete Statistics for the CONUS Max. 8-hour Ozone
Summer (J, J, A) Discrete Statistics for the CONUS Max. 8-hour Ozone Note underprediction east of LA
Discrete Statistics for the CONUS Max. 8-hour Ozone
Discrete Statistics for the CONUS Max. 8-hour Ozone Note the transition from slight underprediction to overprediction.
Discrete Statistics for the CONUS Max. 8-hour Ozone 1 2 3 1 Change in the PBL scheme, from TKE to ACM2 (6/12) 2 Change to the NAM roughness length and canopy resistance calculations (6/19) 3 Corrections to dry deposition, plume rise calculations (7/18)
Summer (J, J, A) Discrete Statistics for the CONUS Max. 8-hour Ozone Regional Analysis 158 Sites 237 Sites 148 Sites 210 Sites 108 Sites 128 Sites
Summer (J, J, A) Discrete Statistics for the CONUS Max. 8-hour Ozone Regional Analysis
Daily Evaluation The performance of the NAQFC was closely scrutinized and summarized on a daily basis from 1 Junethrough 30 September. These summaries, which included meteorological analysis, were openly discussed in weekly team meetings with EPA and NOAA developers. - These summaries are available for dissemination. - An example for 15 August is provided.
Max. 8-Hr OzoneForecast Init: 14 August (12 Z) Valid: 15 August (04 Z to 03 Z) RM UMNE PC LM SE
Case Study Research Simulations for areas of southern California, especially east of the Los Angeles basin have been, on occasion, very poor………why? - Inadequate spatial resolution in complex terrain? - PBL height errors? - Wind errors? - Emission errors? 12 August 13 August 14 August
Case Study Research Simulations for near / offshore areas of the Gulf Coast States have been too high on occasion…..why? - Inadequate spatial resolution to simulate sea / land breeze? - PBL height errors? - Emission errors? 14 August 12 August 13 August
Case Study Research Simulations in “clean” air masses have been too high….why? - Northern Boundary concentrations set too high? 5 September
Summary The National AQFS performed quite well during the summer of 2007 over the CONUS (r = 0.70, NME = 20.4%, NMB = 8.7%) The quality of the forecast system’s performance: - represent a marked improvement over earlier system configurations dating back to 2004; - supported, in part, its transition from experimental status to operational status on September 18th, 2007. Future research will focus on eliminating: - the poorer performance in coastal and/or mountainous areas; - the systematic over-prediction of the forecasts during the later half of the summer..
Thank you Contact Information: eder.brian@epa.gov brian.eder@noaa.gov 919.541.3994 (v) 919.541.1379 (f) Disclaimer: The research presented here was performed under the Memorandum of Understanding between the U.S. Environmental Protection Agency (EPA) and the U.S. Department of Commerce's National Oceanic and Atmospheric Administration (NOAA) and under agreement number DW13921548. This work constitutes a contribution to the NOAA Air Quality Program. Although it has been reviewed by EPA and NOAA and approved for publication, it does not necessarily reflect their policies or views.