Download
1 / 27
270 likes | 468 Views
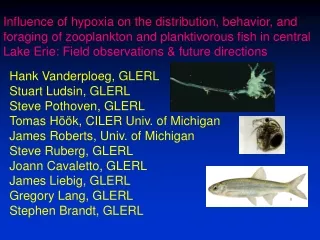
Understanding the Distribution and Behavior of Si Isotopes in the Ocean. Christina L. De La Rocha Alfred Wegener Institute. Diatoms. diatom frustule made from opal aka amorphous, hydrated silica SiO 2 . n H 2 O. 10 m m. Fragilariopsis kerguelensis. photo from G. Cortese.

E N D
Understanding the Distribution and Behavior of Si Isotopes in the Ocean Christina L. De La Rocha Alfred Wegener Institute
Diatoms diatom frustule made from opal aka amorphous, hydrated silica SiO2.nH2O 10 mm Fragilariopsis kerguelensis photo from G. Cortese
Diatoms Matter They carry out: >75% of the new production in coastal, high nutrient environments ~ half of all marine primary production ~ 20% of all primary production occurring on Earth each year and much of the production in the Southern Ocean
The Silica Cyclein Tmol y-1 weathering eolian deposition river input 6 0.5 silica production 240 115 120 dissolution upwelling 91 dissolution sedimentation weathering hydrothermal 29 0.4 0.5 numbers from Tréguer et al., 1995 DeMaster 2002 Elderfield and Schultz, 1996 23 dissolution net burial 6-7
Questions • Can dissolved Si (DSi) utilization by diatoms be reconstructed from Si isotopes? • What is the distribution and behavior of Si isotopes in the modern ocean and how has it been in the past? • Do sediments faithfully record an annually integrated nutrient utilization signal from surface waters?
Notation Silicon has 3 stable isotopes: 28Si 29Si 30Si 92.23% 4.67 % 3.10% Silicon isotope ratio variations are expressed in permil: where RSAM and RSTD are the 30Si/28Si ratio in a sample and standard, respectively.
Fractionation of Si Isotopes During Opal Biomineralization data from De La Rocha et al., 1998; Milligan et al., 2004
d30Si vs Depth blues = Pacific central and coastal N Pac Antarctic (Pac Sector) Pacific subantarctic pink/purple = Atlantic BATS and coastal N Atl Atlantic subantarctic data from De La Rocha et al., 2000; Varela et al., 2004; Cardinal et al., 2005
Fractionation of Si IsotopesField Samples- Monterey Bay from De La Rocha et al., 2000
Fractionation of Si Isotopes: Southern Ocean from Varela et al., 2004
d30Si in Southern Ocean Sediments data from De La Rocha et al., 1998 Brzezinski et al., 2002
Regional Variabilitybut why? data from De La Rocha et al., 1998
Potential Influences on Signal (Other Than Silicic Acid Utilization) • secular variation in whole ocean d30Si • regional/temporal variability in d30Si upwelled to euphotic zone • sediments that do not integrate equally over entire growing season (e.g. bias towards resting spores, more robustly silicified diatoms, etc)
The Silica Cyclein Tmol y-1 weathering eolian deposition river input 6 0.5 silica production 240 115 120 dissolution upwelling 91 dissolution sedimentation weathering hydrothermal 29 0.4 0.5 numbers from Tréguer et al., 1995 DeMaster 2002 Elderfield and Schultz, 1996 23 dissolution net burial 6-7
Examination With Simple 2-box Model from De La Rocha and Bickle, 2005
Impact of Changing Riverine Si Flux 2.5x modern 0.5x modern
Regional Variabilitybut why? data from De La Rocha et al., 1998
d30Si vs Depth blues = Pacific central and coastal N Pac Antarctic (Pac Sector) Pacific subantarctic pink/purple = Atlantic BATS and coastal N Atl Atlantic subantarctic data from De La Rocha et al., 2000; Varela et al., 2004; Cardinal et al., 2005
Modeled Mixed Layer d30Si Wischmeyer et al., 2003
Modeled Mixed Layer d30Si Wischmeyer et al., 2003
d30Si vs DSi blues = Pacific central and coastal N Pac Antarctic (Pac Sector) Pacific subantarctic pink/purple = Atlantic BATS and coastal N Atl Atlantic subantarctic data from De La Rocha et al., 2000; Varela et al., 2004; Cardinal et al., 2005
SO Surface Waters- Model vs Reality model- Wischmeyer et al., 2003 data- Varela et al., 2004; Cardinal et al., 2005
Outlook Suggested areas of attack (samples + modeling) • mapping of d30Si at high spatial resolution • especially upper water column • relative to trace elements (Fe), N isotopes • comparing data with models of Si isotopic composition of ocean, sediments • do we understand all the processes controlling d30Si? • investigating links between species composition and isotopic composition of sediments • improving methods for isolating diatoms from sediments