Download

1 / 15
150 likes | 243 Views
Learn how to gather data on non-resident travel in urban areas through establishment surveys to develop attraction rates and estimate total attractions. Explore sample development, data collection process, fielding strategies, and data processing methods.

E N D
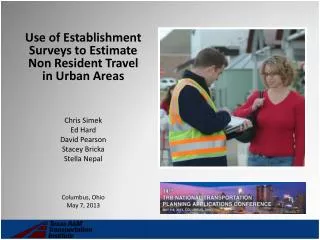
Use of Establishment Surveys to Estimate Non Resident Travel in Urban Areas Chris Simek Ed Hard David Pearson Stacey Bricka Stella Nepal Columbus, Ohio May 7, 2013
Purpose • Collect information on the destination or attraction end of trip • Resident and non-resident • Develop attraction rates for trip generation • Attraction rate = attractions per employee • Stratified by area type (6) and employment type (4)
Design Considerations • Sampling • Data collection process • Fielding • Processing
Sample Development • Drawn from list of WPs • Possible sources • State employment data • Dun & Bradstreet • infoUSA • Sorted by Basic, Service, Retail and Education employment types • Based on NAICS code * Service and Education not included
Sample Size and Stratification • Sample size = what you can afford • Small to medium MPOs (100-300 surveys) • Large MPOs (400-600 surveys) • Stratification • By employment type for small/medium areas • By employment and/or area type, WP size in larger areas • Ratio of full to partial surveys varies • Generally 1/3 to 2/3 Example Workplace Sample Matrix
Data Collection Process • Randomized list of WPs contacted for recruitment • General survey of participating WPs • Pre survey site assessment • CAPI of visitors and employees • Collect information regarding travel to/from WP • Vehicle or person counts
Fielding • Survey team comprised of surveyors and counters • Size of team dependent on size of establishment, number of access points, etc. • Interviews and counts conducted on same day
Data Processing • Geocoded data assigned to study area TAZs and area types • Texas MPO area types based on pop. & employment densities • CBD, CBD Fringe, Urban, Sub-Urban, Sub-Urban Fringe, Rural • Data processed and expanded at each site to vehicle or person control total • Visitor and employee data expanded separately • Trips assessed by trip purpose
Development of WP Attraction Rates • Attraction rates developed by trip purpose • HBW;HBNW-Retail;HBNW-Education;HBNW-Other; NHB; EXT; NON-RES • Person and auto driver trips per employee • CV attraction rates also developed • CV trips per employee • Results compiled by employment and area type
Comparing Productions and Attractions • Attraction rates applied to total employment to estimate total attractions • Compared to total productions from HHTS • Compared to total CV trips from CVS • Texas Practice: Modelers have latitude to use estimate they consider most appropriate in model calibration • WPS Attractions balanced to HH productions • WPS CV attractions balanced to CVS CV productions
Waco MPO - 1,042 Miles2 - 239k persons - 89k households - 14th largest TX MSA - 5,000 establishments - 99,000 employees
Non Resident Travel • Captured in external survey and work place survey • Most of the time not captured in HHTS • WP best estimate of internal NON-RES travel • Person and vehicle counts provide control totals • External survey best estimate of external NON-RES travel • Missing link in NON-RES travel • Internal NON-RES residential travel (Traveling salesman example) • Rule of Thumb → WPS estimates of NON-RES trips are about 5-10% of total HHTS productions • 45,520 NON-RES attractions/ 512,113 total productions = .088 ≈ 8.8%
Questions? Chris Simek (512) 467-0946 C-simek@tamu.edu Ed Hard (979) 845-8539 e-hard@tamu.edu