High-Density SNP Genotyping of Tomato Reveals Selection Patterns Induced by Breeding Practices
This study utilizes a high-density Infinium SNP array to analyze 426 tomato accessions from cultivated and wild varieties, identifying 7,375 polymorphic SNPs. We observed significant genetic differentiation across germplasm groups, particularly on chromosomes 2, 4, 5, 6, and 11. Principal component analysis and linkage disequilibrium assessments demonstrated that modern processing, fresh market, and vintage tomatoes exhibit distinct genetic characteristics, suggesting selective breeding has influenced phenotypic variation in cultivated tomatoes.

High-Density SNP Genotyping of Tomato Reveals Selection Patterns Induced by Breeding Practices
E N D
Presentation Transcript
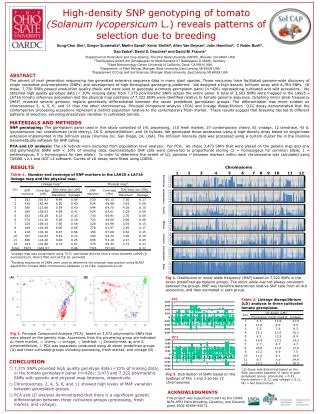
High-density SNP genotyping of tomato (SolanumlycopersicumL.) reveals patterns of selection due to breeding Sung-Chur Sim1, Gregor Surstewitz2, Martin Ganal2, Kevin Stoffel3, Allen Van Deynze3, John Hamilton4, C Robin Buell4, Dan Zarka5, David S. Douches5 and David M. Francis1 1Department of Horticulture and Crop Science, The Ohio State University OARDC, Wooster, OH 44691 USA 2TraitGenetics GmbH, Am Schwabeplan 1b StadtSeeland OT Gatersleben D-06466, Germany 3Seed Biotechnology Center, University of California, Davis, CA 95616 USA 4Department of Plant Biology, Michigan State University, East Lancing, MI 48824 USA 5Departement Of Crop and Soil Sciences, Michigan State University, East Lancing, MI 48824 USA ABSTRACT The advent of next generation sequencing has generated extensive sequence data in many plant species. These resources have facilitated genome-wide discovery of single nucleotide polymorphisms (SNPs) and development of high-throughput genotyping platforms. We designed a high density Infinium array with 8,784 SNPs. Of these, 7,720 SNPs passed production quality check and were used to genotype a tomato germplasm panel (n=426) representing cultivated and wild accessions. We obtained high quality genotype data (< 10% missing data) from 7,375 polymorphic SNPs across the entire panel. A total of 3,503 SNPs were mapped in the LA925 x LA716 tomato reference population and the physical map positions of 7,322 SNPs were identified relative to tomato genome sequence. Graphing minor allele frequency (MAF) revealed several genomic regions genetically differentiated between the seven predefined germplasm groups. The differentiation was more evident on chromosomes 2, 4, 5, 6, and 11 than the other chromosomes. Principal component analysis (PCA) and linkage disequilibrium (LD) decay demonstrated that the contemporary processing accessions represent a distinct population relative to the contemporary fresh market. These results suggest that breeding has led to different patterns of selection, providing phenotypic variation in cultivated tomato. MATERIALS AND METHODS SNP genotyping: The germplasm panel used in this study consisted of 141 processing, 110 fresh market, 27 contemporary cherry, 61 vintage, 12 larndrace, 43 S. lycorpersicum var. cerasiformae (wild cherry), 16 S. pimpinellifolium, and 16 hybrids. We genotyped these accessions using a high-density array based on single-base extension implemented in the Infinium assay (Illumina Inc. San Diego, CA, USA). The Infinium intensity data was processed using a custom cluster file in the IlluminaGenomeStudio software for SNP calling. PCA and LD analysis: The 16 hybrids were excluded from population level analysis. For PCA, we chose 3,473 SNPs that were placed on the genetic map and only sed polymorphic SNPs with < 10% of missing data. GenomeStudio SNP calls were converted to proportional scoring (2 = homozygous for common allele; 1 = heterozygous; 0 = homozygous for rare allele). In order to determine the extent of LD, pairwise r2 between markers within each chromosome was calculated using TASSEL v2.1 and GGT v2 software. Curves of LD decay were fitted using LOESS. RESULTS Chromosome 1 2 3 4 5 6 7 8 9 10 11 12 Processing 1.0 0.8 0.6 0.4 0.2 0.0 Fresh Market 1.0 0.8 0.6 0.4 0.2 0.0 Cherry 1.0 0.8 0.6 0.4 0.2 0.0 Vintage 1.0 0.8 0.6 0.4 0.2 0.0 Landrace (A) (B) 1.0 0.8 0.6 0.4 0.2 0.0 Cerasiformae 1.0 0.8 0.6 0.4 0.2 0.0 Pimp 1.0 0.8 0.6 0.4 0.2 0.0 Fig 1. Distribution of minor allele frequency (MAF) based on 7,322 SNPs in the seven predefined germplasm groups. The minor allele was not always consistent between the groups. MAF was therefore determined relative SNP calls from all 410 accessions, and then estimated in each group. PC1 Fig 2. Principal Component Analysis (PCA) based on 3,473 polymorphic SNPs that were placed on the genetic map. Accessions from the processing group are indicated ∆; fresh market, ○; cherry, □; vintage, ; landrace, ; Cerasiformae, ■; and S. pimpinellifolium, . PCA was separately conducted using all seven predefined groups (A) and three cultivated groups including processing, fresh market, and vintage (B). PC2 • CONCLUSION • 7,375 SNPs provided high quality genotype data (<10% of missing data) in the tomato germplasm panel (n=426): 3,473 and 7,322 polymorphic SNPs with genetic and physical map locations, respectively. • Chromosomes, 2, 4, 5, 6, and 11 showed high levels of MAF variation between germplasm groups • PCA and LD analysis demonstrated that there is a significant genetic differentiation between three cultivated groups (processing, fresh market, and vintage). Fig 3. Distribution of SNPs based on the loadings of PCs 1 and 2 across 12 chromosomes ACKNOWLEDGMENTS This project was supported in part by the USDA NIFA AFRI Plant Breeding, Genetics, and Genome grant 2009-85606-05673.