Download
1 / 28
280 likes | 365 Views
Explore the effects of electric vehicle adoption on CT zip codes at different electricity rates, analyzing job impacts, GHG reductions, and capital stock adjustments from 2013 to 2030.

E N D
Electric Vehicle Adoptions among CT Zip Codes atFlat and Off-Peak Electricity Rates: County Impacts REMI Seminar Lake Tahoe, 12 October 2012 Peter E Gunther Senior Research Fellow CCEA
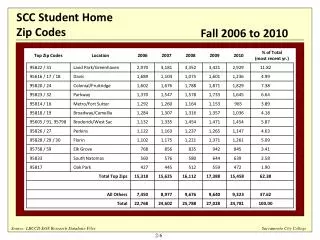
Introduction: Zip Code Data • Yearly Vehicle registrations by type 2005-2009 • Aggregate Family Incomes • Commuters from Destination Zip Code (ZC) by Distance Ergo electric and gas used in GM’s Volts • Distance Ranges by Commuters possibly in EVs: • Volts 50 Miles • Tesla Up to 400 Miles – Sedans Out in Mid 2012 • CT Data on 252 residential ZCs out of 341
Background Process • Used Annual Cross-Sectional Data on 252 CT ZCs to Estimate Registrations in Other 89 • Mapped Market Penetrations @ 5% and 25% • Approximation of Required Transformer/Transmission Upgrades • Projected EVs and Total Light Vehicle Growth • Transformer Upgrades at: • 5% Market Penetration If Charged at Flat Rates • 25% Market Penetration If Charged at Off-Peak Rates
Concentrations of Zip Codes Requiring Transmission Upgrades in 2022 Flat Rates (n=341)
Concentrations of Zip Codes Requiring Transmission Upgrades in 2022 Off-Peak Rates (n=341)
Stepwise Approach: Bifurcated for Flat and Off-Peak Rates • Based on Elasticities on the Spread between Flat and Off-Peak Rates in CT Developed a Cost Neutral Rate Spread for Homeowners to Attain Off-Peak Rates • Incremental Household Savings on Gasoline • = Increased Electricity Costs + Increased Consumption Reallocation • Off-Peak Electricity Savings $ Exceed Flat
Analytical Progression • Straight Substitution of Electricity for Gasoline • GHG Reductions – Amenity Benefits @ $38.98/tonne CO2eq • Capital Adjustments-Accelerating Actual Non-Residential Capital Toward Optimum Capital
Connecticut Job Impacts from Adopting EVs 2013-2030 Flat and Off-Peak Rates without Amenities
GHG Relative Intensity of GHG Reductions 2027
Connecticut Impacts from Adopting EVs Flat and Off-Peak Rates with & without Amenities (# of Jobs)
2023 & 2028 Sector Impacts from Adopting EVs at Flat and Off-Peak Rates with & without Amenities (# of Jobs)
Connecticut Impacts on Capital Stock (Millions Fixed 2005 $) 2023 2028
Connecticut Impacts on Capital Stock: Flat Rates no Amenities (Millions Fixed 2005 $)
Capital Adjustments • This Study Produced Estimates of Actual and Optimal Changes to Capital Stock for Each Scenario • Given that Reliability Is a Virtual Necessity, • The Gap between Optimal and Actual Is Used as a Proxy for Capital Adjustment: • 40% Construction • 30% Producer Durable Purchase of Engines & Turbines • 30% Producer Durable Purchase of Transmission
Job Impacts of Capital AdjustmentsFlat Rates Off-Peak Rates
Job Impacts with Replacement Batteries Flat Rates Off-Peak Rates
Real Income Impacts (Millions Fixed 2005 $) Flat Rates Off-Peak Rates
Current Income Impacts Before Financing (Millions Current$) Flat Rates Off-Peak Rates
Further Rate Adjustments? • Scott’s approach is to adjust rates to cover capital costs • Yet, in this scenario new electricity supplies are demand driven • Test: If value added by utilities exceeds incremental capital expenditures by a significant margin, then no further rate adjustments may be need.
Utility Value Added before & after Deducting Capital Expenses (Millions 2005 $)
Employment Summary Flat Rates Off-Peak Rates
Current Income Impacts Inclusive of Financing (Millions Current $) Flat Rates Off-Peak Rates
Utility Output Impacts (Millions 2005 $) Flat Rate Off-Peak Rates
Utility Output Impacts (% of Base) Flat Rate Off-Peak Rates
Conclusions • Off-peak electricity rates position EV owners to save on EV transportation operating costs and to allocate more household income to other consumption than occurs with flat rates. • With curtailed demand for gasoline, stations will close causing a drop in retail employment in all scenarios • Prior to Capital Adjustments, the Off-Peak Rate Structure Generates More Jobs and Income • Including Financing in the Model is Necessary – It Increases Employment and Income Impacts • Utility Output Impacts under Off-Peak Rates are About two-Thirds of Those under Flat Rates. • While Flat Rates Appear to Generate More Income this Occurs Only Because the Capital Adjustment Is $600 Million Higher than Necessary under Off-Peak Rates - A Measure of the Wasted Resources from Misguided Flat Rate Policies!