Download
1 / 51
510 likes | 674 Views
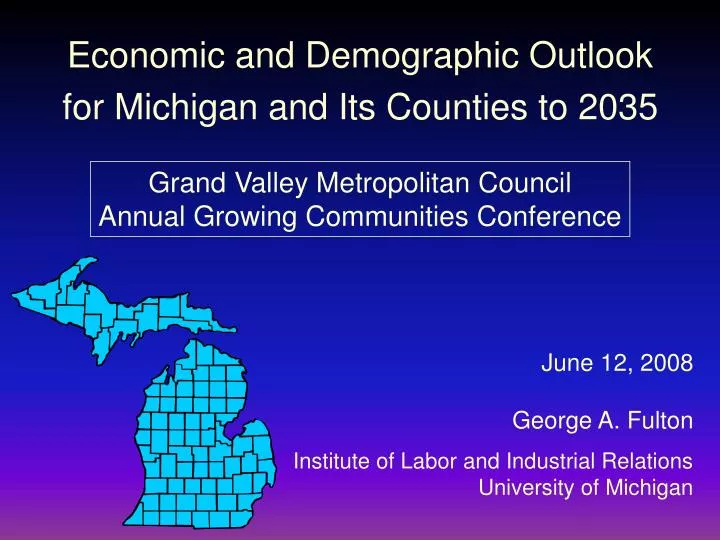
Economic and Demographic Outlook for Michigan and Its Counties to 2035. Grand Valley Metropolitan Council Annual Growing Communities Conference. June 12, 2008 George A. Fulton Institute of Labor and Industrial Relations University of Michigan. Background on the Forecasts.

E N D
Economic and Demographic Outlook for Michigan and Its Counties to 2035 Grand Valley Metropolitan Council Annual Growing Communities Conference June 12, 2008 George A. Fulton Institute of Labor and Industrial Relations University of Michigan
The forecast is in partnership with MDOT and is the product of: • The REMI economic and demographic forecasting and • simulation model • The forecasting expertise of the U-M economists • Comments and insights of a number of local MPOs • and regional planning organizations
● ● Included are demographic and economic forecasts for: County results can be added to form any region. 1. Every county in Michigan 2. The state as a whole (a summation of the county results)
Long-term forecasts are intended to identify economic trends ● Forecasts are unable to capture major one-time events ● General Observations on the State and County Forecasts for 2005–2035 — NOT to predict business cycle movements — unless there is prior knowledge of the event and external information is directly introduced into the forecast — e.g., Google and Pfizer in Washtenaw County
General Observations on the State and County Forecasts for 2005–2035 • Some counties have special circumstances that cause • them to deviate from the general trends—for example, a • county with a large college-age population. • The long-term outlook for regions is governed by: • Prospects at the national level 2. Trends in productivity growth 3. The mix of industries within regions (e.g., growing service sector, declining goods-producing sector) 4. Demographic trends
Fundamental Drivers in Michigan’s Long-term Outlook • The consequences of profound changes in the • auto industry • The level of investment in other activities that show • promise for future growth and prosperity, and for • which the region has supporting assets • The impact of the aging of the “baby-boomer” • generation, and the migration patterns of the • younger and well-educated populace
75% Market share Sales 12 70% 11 65% 10 60% 9 55% 50% 8 ’91 ’92 ’93 ’94 ’95 ’96 ’97 ’98 ’99 ’00 ’01 ’02 ’03 ’04 ’05 ’06 ’07 Detroit Three: Sales of Light Vehicles and Market Share of Total Sales United States, 1991–2007 Sales in millions of units Market share 72.6 50.4
Employment Location Quotients by IndustryMichigan, 2006 Industry Location Quotient Automobile, light truck, and parts manufacturing 7.15 Detroit Three vehicle and parts manufacturing (end of 2005) 12.29 Manufacturing except autos and parts 1.05 Private nonmanufacturing 0.95
1995 $ 12 10 8 6 4 2 0 ’95 ’96 ’97 ’98 ’99 ’00 ’01 ’02 ’03 ’04 ’05 ’06 ’07 ’08 ’09 GFGP RevenueFiscal 1995–2009 Billions $ Current $
Short-term forecast 11.2 11.0 10.8 per per per 2014 exceeds 2005 population level 10.6 10.4 * + 0.35% – 0.10% + 0.23% 10.2 year year year 10.0 9.8 9.6 Michigan Population, 2000–2035 Millions Long-term forecast Actual ’00 ’05 ’10 ’15 ’20 ’25 ’30 ’35
+ + = + = + Natural change in population Total change in population Net domestic migration Net international migration Components of Population Change in Michigan Thousands 1000 800 600 400 200 + + = 0 –200 –400 –600 2000–2005 2005–2010 2010–2035
2005 40% 2035 35% 30% 25% 20% 15% 10% 5% 0% 0 to 24 25 to 44 45 to 64 65 plus Population Distribution by Age Group Michigan, 2005 and 2035 34.6 29.3 27.5 25.5 24.2 23.1
2005 40% 2035 35% 30% 23.4 25% 20% 12.4 15% 10% 5% 0% 0 to 24 25 to 44 45 to 64 65 plus Population Distribution by Age Group Michigan, 2005 and 2035
Short-term forecast per per per * 2022 exceeds 2000 employment level + 0.26% – 0.40% – 0.24% year year year Total Employment in Michigan, 2000–2035 (BEA definition—includes self-employed, farm, military) Millions 5.85 Actual Long-term forecast 5.80 5.75 5.70 5.65 5.60 5.55 5.50 5.45 5.40 5.35 5.30 ’00 ’05 ’10 ’15 ’20 ’25 ’30 ’35
2000 2005 2010 2035 5,518,947 5,453,071 Change 2000–2005 2005–2010 2010–2035 Total change – 110,551 – 65,876 – 22,110 – 13,175 Avg. per year Total Employment in Michigan 5,629,498 5,812,239 + 359,168 + 14,367
1985–2010 2010–2035 Total Employment in Michigan 25-Year Growth Rate 28.1% 6.6%
Industry Employment Forecasts for Michigan
Michigan Average Wage 2006 $42,157 48,216 30,111 68,828 91,798 54,625 49,693 43,403 39,530 High-Education Industries % of U.S. Employment with Bachelor’s or More, 2000 Average for all industries 27.2% Average, all high-education industries Private education services 61.2% Professional & technical services 58.0% Management of companies 49.1% Information 39.1% Financial activities 36.0% Government 33.4% Health care, social assistance 32.7%
2001 2005 2010 2035 2,321,448 2,364,930 Change 2001–2005 2005–2010 2010–2035 Total change + 99,093 + 43,482 + 24,773 + 8,696 Avg. per year Employment in High-Education Industries in Michigan 2,222,355 2,675,277 + 310,347 + 12,414
Employment Change ’05–’10 ’01–’05 ’10–’35 310,347 43,482 99,093 2001 15,795 3,375 19,105 104,913 18,195 –2,267 2,131 –1,361 –1,558 –4,759 –1,342 –6,409 24,845 1,804 48,933 –15,292 –26,529 –12,367 182,714 49,340 53,656 High-Education Industries in Michigan High-ed. industries 2,222,355 Pvt. education svcs. 73,183 Prof. & tech. svcs. 366,306 Mgmt. of companies 68,848 Information 87,123 Financial activities 375,624 Government 699,496 Health care, social assistance 551,775
% of U.S. Employment with Bachelor’s or More, 2000 Michigan Average Wage 2006 $42,157 37,807 Arts, entertainment, recreation 26.4% 26,135 Other services (repair, personal, civic) 19.5% 25,700 Manufacturing 19.2% 58,070 Trade, transportation, & utilities 16.4% 35,638 Administrative services 15.5% 31,241 Farm, natural resources, mining 13.7% 29,436 Construction 9.7% 46,561 Accommodation, food services 8.7% 12,664 Low-Education Industries Average for all industries 27.2% Average, all low-education industries
2001 2005 2010 2035 3,197,499 3,088,140 3,136,962 Change 2001–2005 2005–2010 2010–2035 Total change – 120,033 – 109,359 + 48,822 – 30,008 – 21,872 + 1,953 Avg. per year Employment in Low-Education Industries in Michigan 3,317,532
’05–’10 ’01–’05 ’10–’35 Low-ed. industries 3,317,532 –120,033 –109,359 48,822 2001 Arts, enter., rec. 100,369 30,952 6,406 3,066 Other services 285,445 –3,283 16,162 13,638 Manufacturing –154,412 –142,839 –74,382 843,743 Trade, trans., util. 1,007,145 –40,532 –37,912 –22,158 Admin. services 107,167 322,152 33,941 17,744 Farm, nat. res., mining –23,161 104,019 –4,708 –3,658 Construction –35,611 304,276 –2,923 26,725 Accommodation, food 350,383 85,921 13,314 9,973 Low-Education Industries in Michigan Employment Change
High-ed. industries +24,773 +8,696 +12,414 –30,008 –21,872 +1,953 Low-ed. industries 2001–2005 2005–2010 2010–2035 Summary: Employment by Educational Composition Average Change per Year
Forecasts of Income and Households for Michigan
1.2% 1% 0.8% 0.6% 0.4% 0.2% 0% Average Annual Growth in Michigan Per Capita Income (2005 $) 1.0% 0.8% 0.3% 2001–2005 2005–2010 2010–2035 Total Growth over the Interval 1.3% 4.1% 29.2%
Households 3,863,662 3,981,427 4,635,109 20.0% Average household size 2.56 2.47 2.31 NA Number of Households in Michigan 2005–2035 % Change 2005 2010 2035 2005–2035 Total population 10,100,833 10,057,256 10,982,682 8.7% Group quarters 224,190 227,781 296,548 32.3% Population in households 9,876,643 9,829,475 10,686,134 8.2%
40% 2005 35% 30% 2035 25% 20% 16.0 14.1 13.8 15% 11.3 10.0 8.2 10% 5% 0% Distribution of Michigan Households by Size, 2005 and 2035 36.0 33.8 30.4 26.4 1 2 3 4 5+ Number of persons in household
County Population and Employment Forecasts
Growth >statewide average Growth < statewide average Decline Change in Population by Michigan County 2005–2035
Growth >statewide average Growth < statewide average Decline Change in Employment by Michigan County 2005–2035
Growth > twice statewide average Rest of state Change in Employment by Michigan County 2005–2035
30-Year Growth Rate, 2005–2035 Population Employment Allegan 18.9% 12.3% Barry 11.0% 8.0% Ionia 11.2% 2.2% Kent 21.6% 14.9% Montcalm 12.2% –11.7% Ottawa 24.2% 11.6% MICHIGAN 8.7% 5.3% Long-Term Population and Employment Outlook for GVMC Counties
Growth in both population and employment will be much slower in Michigan between 2005 and 2035 than during the 1990s. ● The largest declines, however, will be in manufacturing, especially motor vehicle manufacturing, due to: ● Employment in natural resources, retail trade, and government will decline over the next 30 years. ● 1. Loss of Detroit Three market share • Productivity gains in the auto industry and other • manufacturing industries 3. Shift in consumer spending away from goods and toward services, especially as we age
Regions with a large share of employment in the declining industries will see little if any job gain over the next 30 years, and many will see employment declines because of the age structure of the existing population. ● Regions with a large share of employment in the growing industries have the potential for relatively healthy employment gains over the next 30 years, but job growth will depend on growth in the working- age population. ● Employment will increase in finance, professional and business services (which includes temporary and leased workers), private education, health and social services, and leisure and hospitality services. ●
The fastest-growing counties in Michigan are clustered in four geographic areas: ● The urban and suburban Grand Rapids area The tourist-oriented and retiree-friendly northwestern lower peninsula, particularly the Traverse City area The suburban Lansing area The area most concentrated in high-education industries, comprising the counties of Oakland, Livingston, and Washtenaw counties — — — —
Although the slowest-growing counties in Michigan are scattered throughout the state, there are three general areas of greater concentration: ● The rural areas of the Upper Peninsula The area along the shores of Lake Huron The strip of counties along the state’s southern border — — —
We are getting much older. By 2035, more than 23 percent of Michigan’s residents will be 65 or older. ● Compare this with the situation in Florida today. In the state known as “God’s waiting room,” 17 percent of the residents are 65 or older. ●
Total population in Michigan increases by 8.7 percent between 2005 and 2035. ● Group home population increases by 32.3 percent over this period as the aging population enters assisted living facilities, including nursing homes. ●
The population living in households increases by 8.2 percent, but the numberof householdsincreases by 20 percent. ● Average household size is declining because older residents tend to live in smaller-sized households. Except as related to age, we have not made any other assumptions about household size preferences. ●
Despite sluggish job growth over the forecast period, healthy aggregate productivity growth leads toa rising standard of living. ● Inflation-adjusted incomes will increase over time, but Michigan’s economic position will be determined by its residents’ level of education. ●
The knowledge-based economy, and the educated workers who fuel it, are the fulcrum of future prosperity in Michigan. ● Bill Gates observed that for knowledge-based enterprises, educational attainment trumps everything when they’re deciding where to invest. ● Michigan and its communities need to invest in programs to provide the education and training essential for the economy of the future. ● Opportunities for Economic Development in Michigan
Among activities with fewer educational requirements, the hospitality industry shows promise for the future, providing services to visitors as well as to a growing numberof older people. ● Support personnel for industries with the most favorable growth prospects—health care and professional/ technical services—require skills but often not professional degrees. ● Other actions may show promise for the economic well-being of the state, but none is more compelling than investing in workforce development. ● Opportunities for Economic Development in Michigan
● Oil prices Credit crisis ● ● Local housing market Short-TermRisks to the Economy
● Severe labor shortages ● Not attracting knowledge-based and elder- friendly businesses Long-Term Risks to the Economy
● Short-term risks? ● Longer-term risks? Build strong health care system ► Improve recreational and cultural amenities ► Attract emerging industries ► Increase technological collaboration ► Emphasize education and training ► What Can Local Public and Private Leaders Do? Almost nothing.