Quantitative Analysis of IRP1 Immunoreactivity in HEK293 Cell Fractions
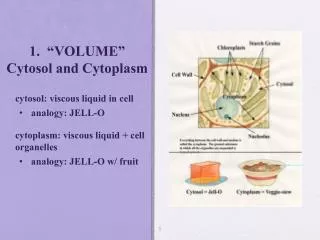
This study examines the immunoreactivity of Iron Regulatory Protein 1 (IRP1) in both cytosolic and membrane fractions of HEK293 cells treated with deferoxamine (DFO) and ferric ammonium citrate (FAC). The data presents a quantitative assessment of IRP1 levels across different conditions, revealing significant differences in immunoreactivity between treated and control groups. These findings enhance our understanding of IRP1's role in cellular iron homeostasis and may contribute to the broader investigation into iron metabolism in human cells.

Quantitative Analysis of IRP1 Immunoreactivity in HEK293 Cell Fractions
E N D
Presentation Transcript
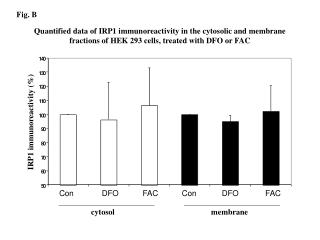
Fig. B Quantified data of IRP1 immunoreactivity in the cytosolic and membrane fractions of HEK 293 cells, treated with DFO or FAC 1 4 0 1 3 0 1 2 0 1 1 0 1 0 0 IRP1 immunoreactivity (%) 9 0 8 0 7 0 6 0 5 0 Con DFO FAC Con DFO FAC cytosol membrane